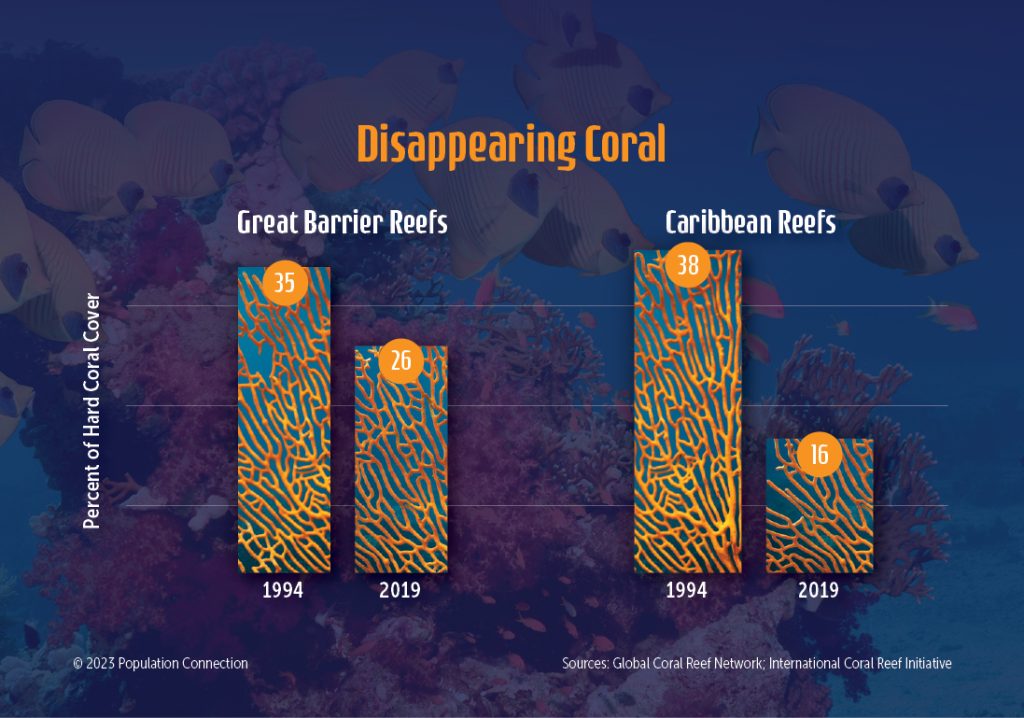
Graphs show the percentage of the Caribbean Reefs and Great Barrier Reefs over 25 years, in 2019 compared to 1994.
Reef data is from the Global Coral Reef Network and the International Coral Reef Initiative.
Graphic originally published on the Quick Trip to 8 Billion wall chart.
Other Resources You Might Like:
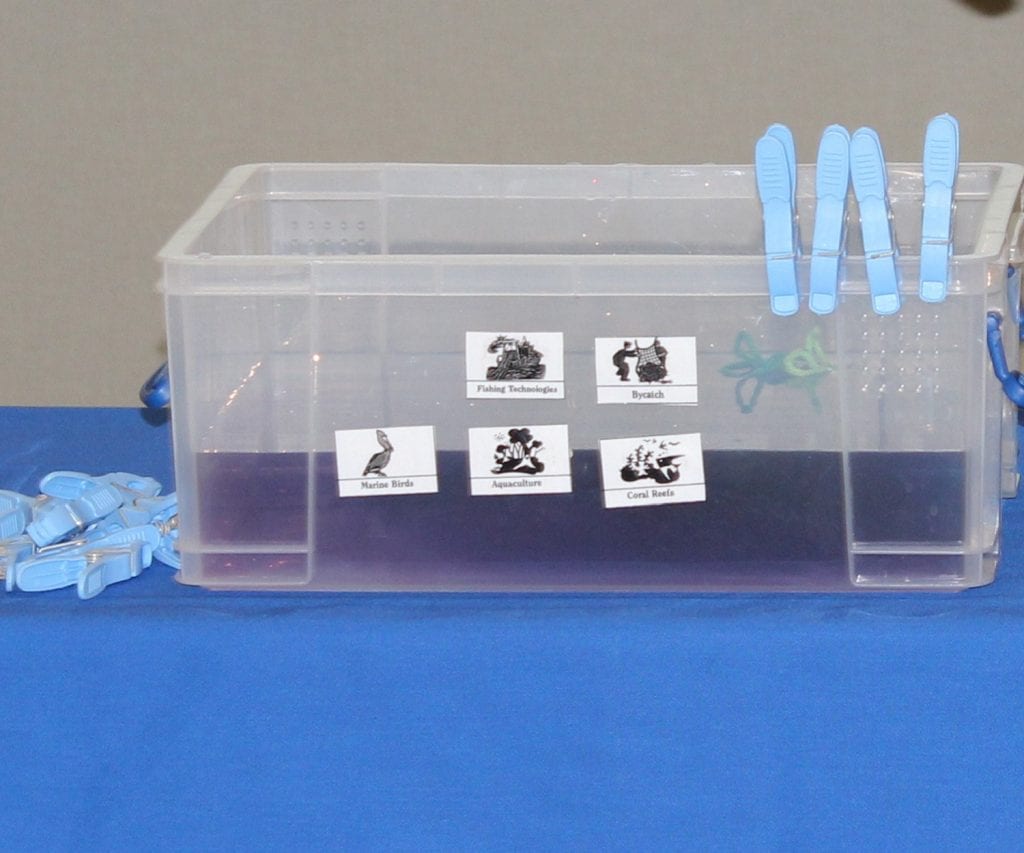
As the instructor reads a historic story, students add and extract items from a model ocean based on real-world events.
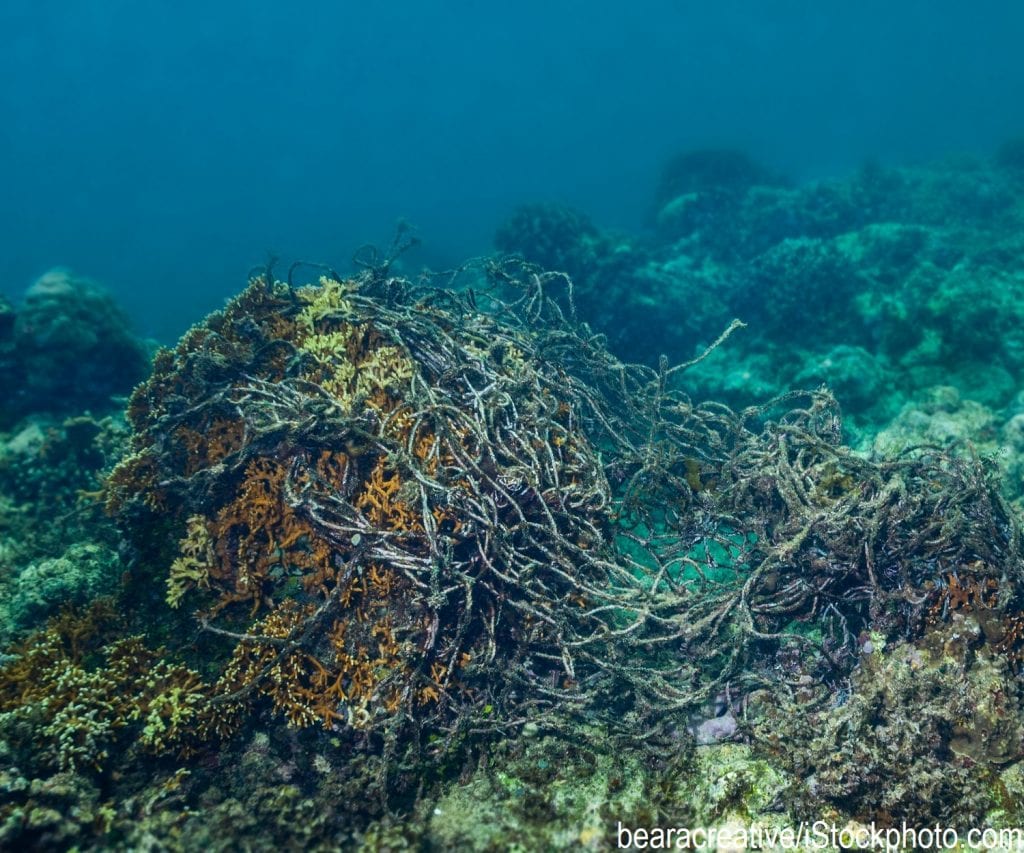
Oceans background reading: Take a closer look at the largest habitat on Earth and see the impact of humans’ demands... Read more »
Biodiversity background reading: This overview explores why biodiversity is important and what trends are threatening so many of the world’s... Read more »
Nice to meet you!
Tell us a bit about yourself so we can continue creating resources that meet your needs.
You’ll only need to fill out this form once. If you’ve already completed the form, you can confirm your email here.