SUBJECTS: Language Arts, Math, Science, Social Studies

TOPICS: Air Pollution, Climate Change, Oceans

Resource Overview

In this climate change and data analysis lesson, students engage with a variety of data formats—including graphs, written reports, and visual evidence—to explore the interconnected effects of population growth, greenhouse gas emissions, global temperature rise, land ice melt, and sea level rise. This activity is aligned with NGSS and environmental science standards.

Use this video alongside our People and Climate Change: The Data Is In lesson plan to help students build their skills in critical thinking, data literacy, and systems thinking. For more details on this lesson, click here.

Audio transcript of People and Climate Change: The Data Is In lesson plan video


Other Resources You Might Like:

Grades
Code Blue: Endangered Oceans

As the instructor reads a historic story, students add and extract items from a model ocean based on real-world events.

Students measure the length of their steps and calculate where they'd end up after one million steps
Grades
Measuring a Million

Through riddles and cooperative learning math activities, students work through problems to calculate and visualize millions and billions of things... Read more »

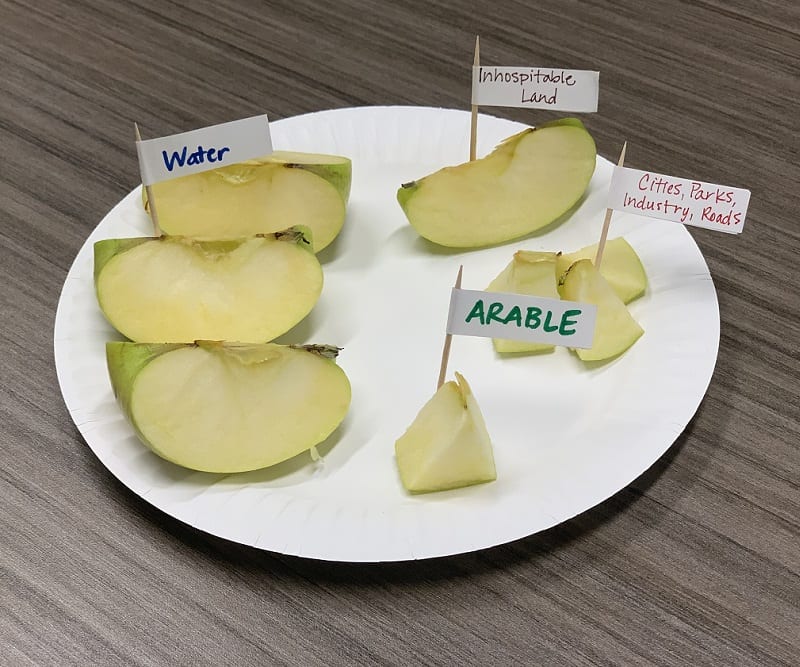
Apple slices represent different areas of the Earth: water, inhospitable land, used arable land, and arable land for farming
Grades
Earth: The Apple of Our Eye (middle grades)

An apple is used as a model to illustrate the limited farmland available on Earth.