Grade Level:
9-12
Teacher Resources


Written and scaffolded for ELL, students develop a community's Sustainability Index and put the Index to use...
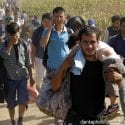
Population Dynamics case study reading: Explore migration to the European Union: the push factors forcing people from...

Population Dynamics case study reading: Examine two countries with sub-replacement fertility rates, their path to this status,...
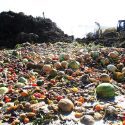
Food and Agriculture case study reading: An in-depth look at the food supply chain in the United...
PopEd Impact
campuses
"The activities not only bring out important content, but they also provide real-world context for environmental, population and sustainability issues. They engage participants in very thought-provoking and critical-thinking discussions.”
Helen de la Maza, Environmental Educator, Irvine, CA