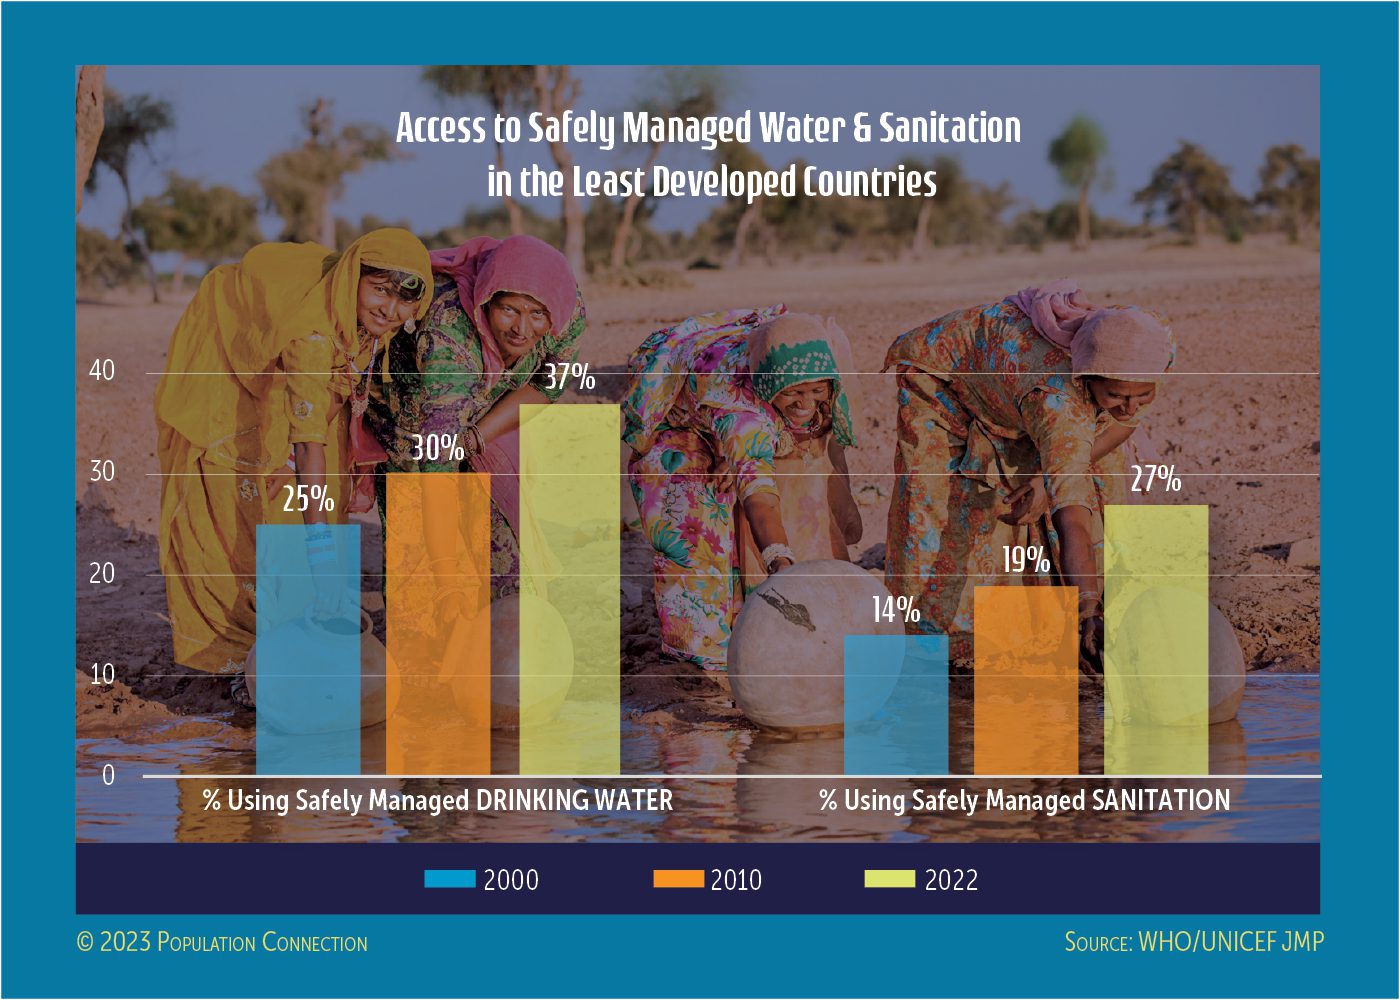
Bar charts shows the percentage of people using safely managed drinking water and safely managed sanitation in the least developed countries. The percentage of people with access has increased from 2000 to 2022, but there is still much work to be done.
Data from WHO/UNICEF JMP.
Graphic originally published on the Quick Trip to 8 Billion wall chart.

Other Resources You Might Like:
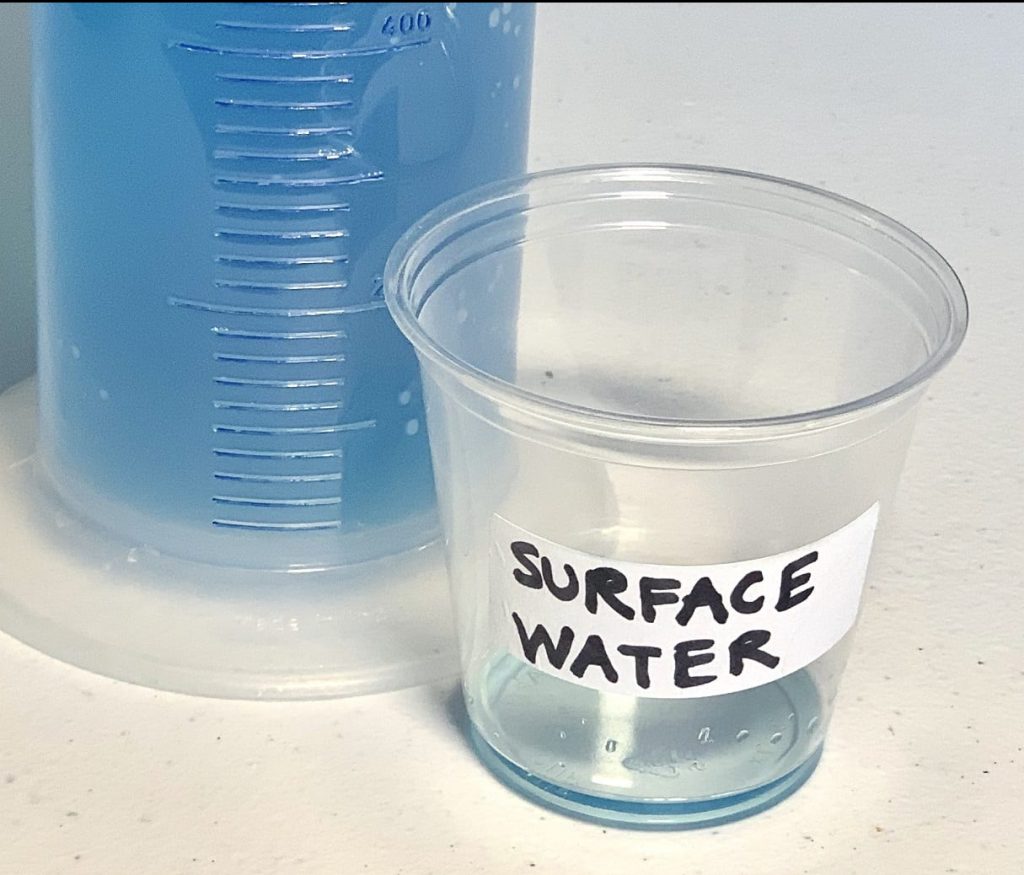
Students observe a brief demonstration on the distribution of the world’s water and then calculate how much water they use... Read more »
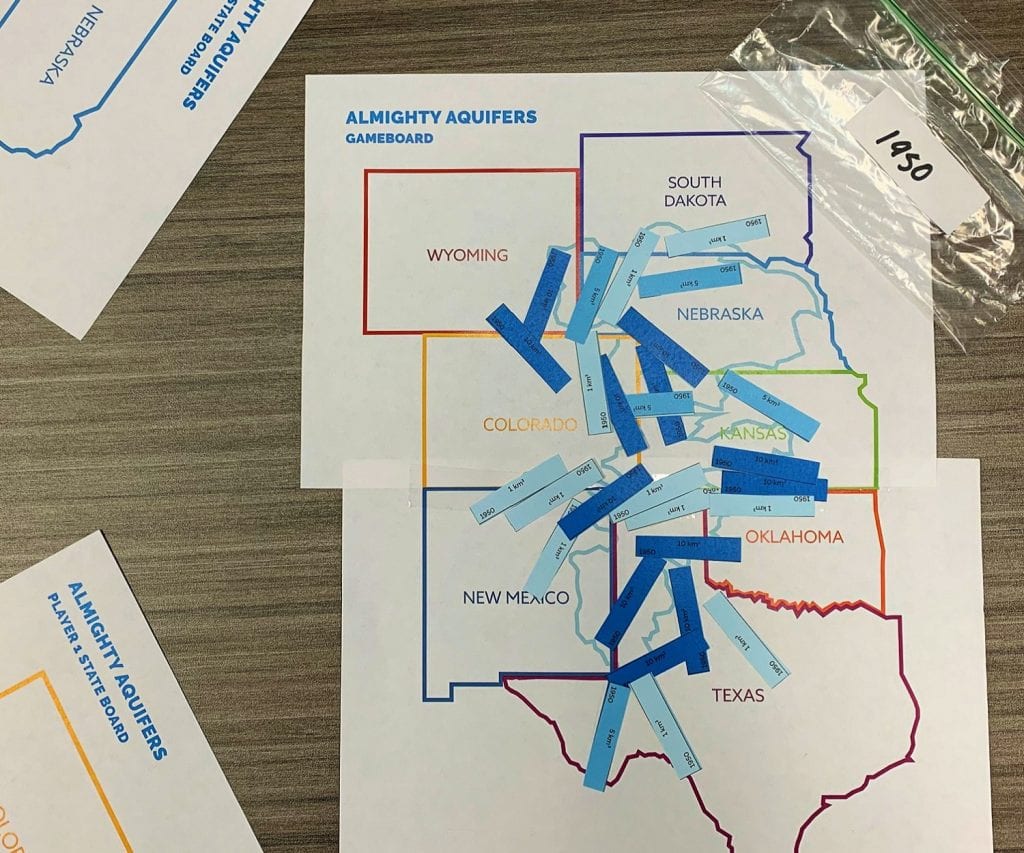
Students play a game mimicking the relationship between population growth and U.S. aquifer depletion.
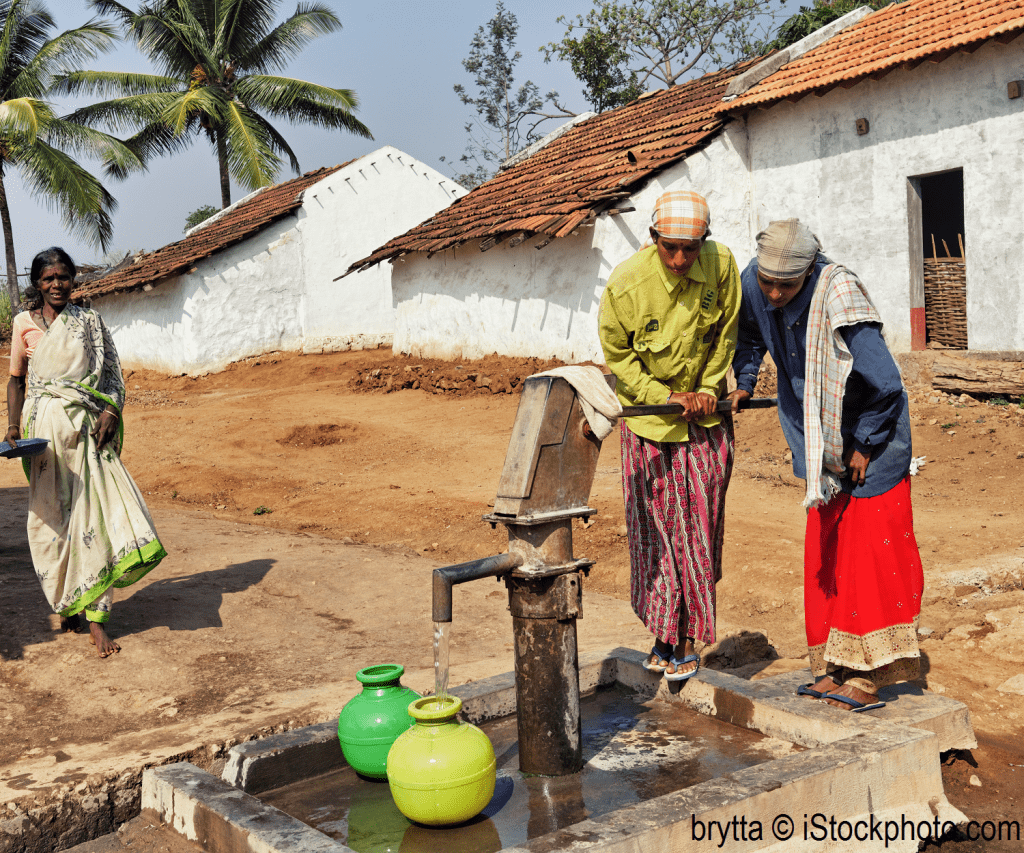
Water resources case study reading: Charitable programs building water wells in sub-Saharan Africa have learned that providing sustainable water sources... Read more »
Nice to meet you!
Tell us a bit about yourself so we can continue creating resources that meet your needs.
You’ll only need to fill out this form once. If you’ve already completed the form, you can confirm your email here.