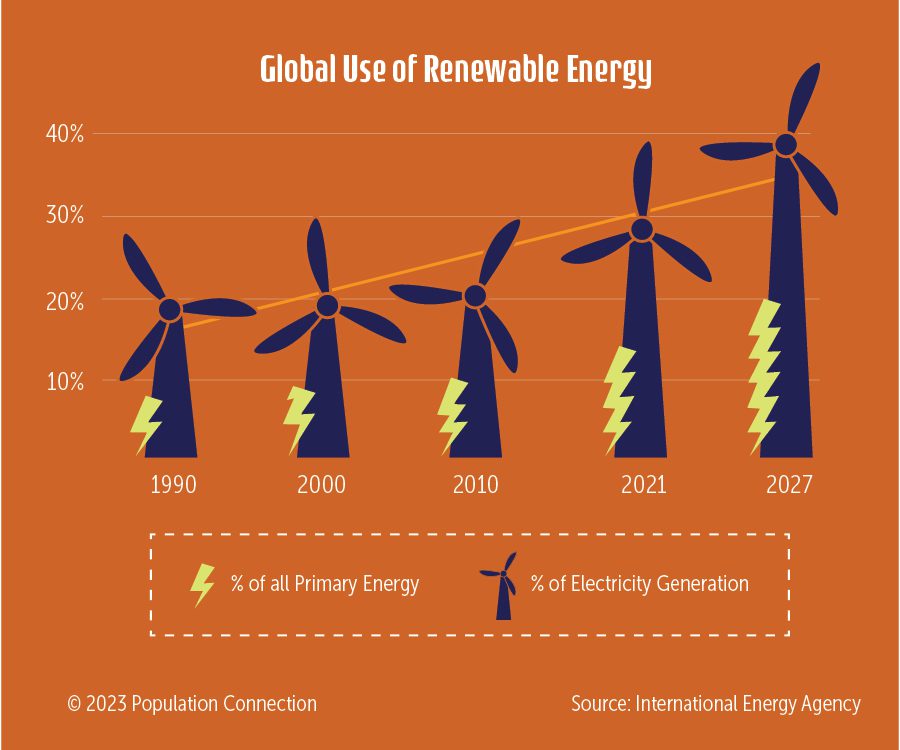
Bar graph compares the percentage of global energy use that is from renewable sources in 1990, 2000, 2010, 2021, and projected use in 2027. The percentage of all primary energy and the percentage of electricity generation from renewables have increased.
Data is from the International Energy Agency
Graphic originally published on the Quick Trip to 8 Billion wall chart.
Other Resources You Might Like:
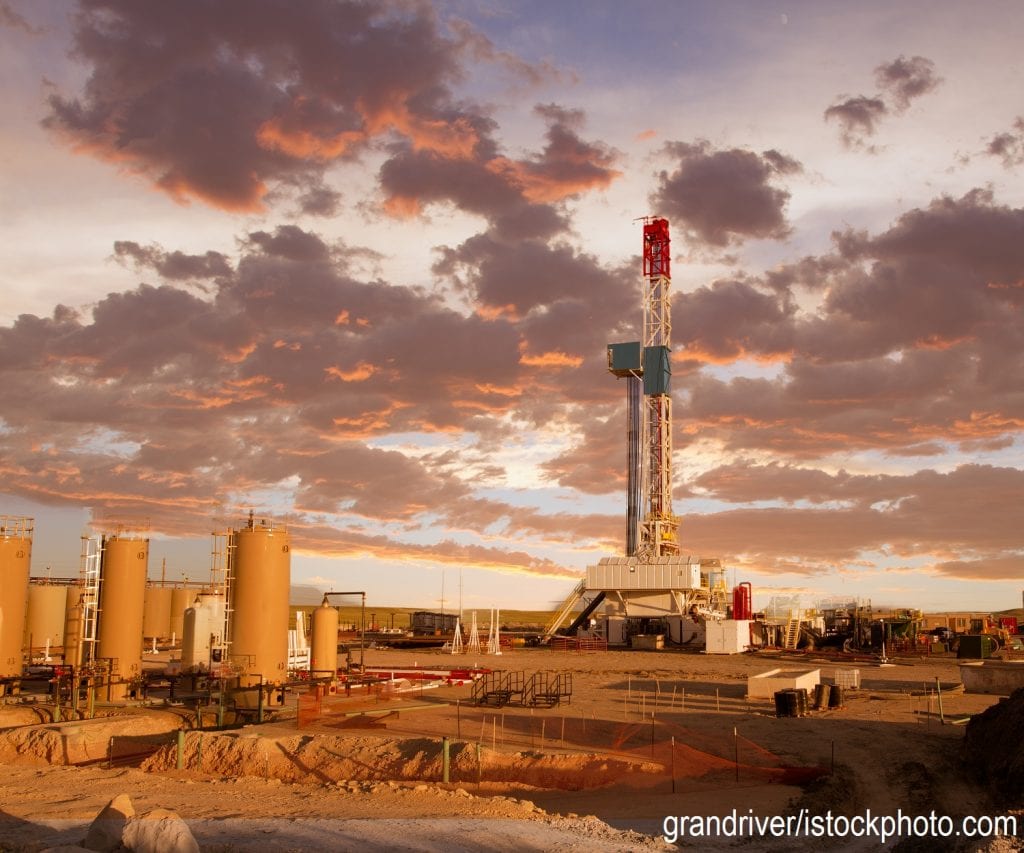
Students analyze information about fracking and their sources for bias and ultimately take a stance arguing for or against fracking.... Read more »

Land use background reading: As population grows, we develop wild areas and arable land and overuse resources like soil, minerals,... Read more »
Nice to meet you!
Tell us a bit about yourself so we can continue creating resources that meet your needs.
You’ll only need to fill out this form once. If you’ve already completed the form, you can confirm your email here.