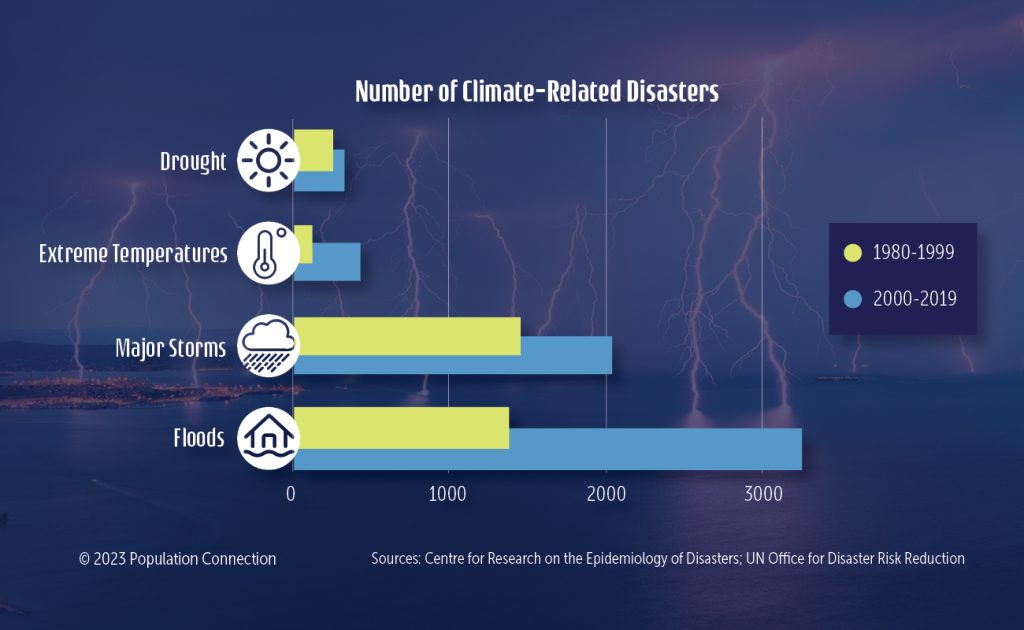
Infographic compares the number of climate-related disasters between 1980-1999 with the number of disasters between 2000-2019. Climate-related disasters include drought, extreme temperatures, major storms, and floods.
Data is from the Centre for Research on the Epidemiology of Disasters and the UN Office for Disaster Risk Reduction.
Graphic originally published on the Quick Trip to 8 Billion wall chart.
Other Resources You Might Like:
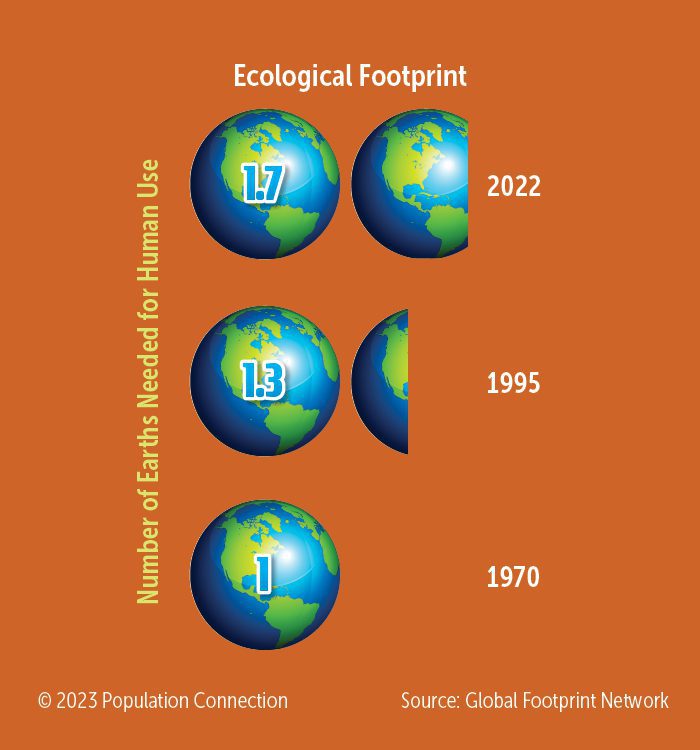
Earth graphics display human's growing global footprint from 1970 to 1995 to 2022.

Explores how the amount of carbon emitted and vulnerability to climate-related risks varies between countries.

As the instructor reads a historic story, students add and extract items from a model ocean based on real-world events.
Nice to meet you!
Tell us a bit about yourself so we can continue creating resources that meet your needs.
You’ll only need to fill out this form once. If you’ve already completed the form, you can confirm your email here.