Resource Overview
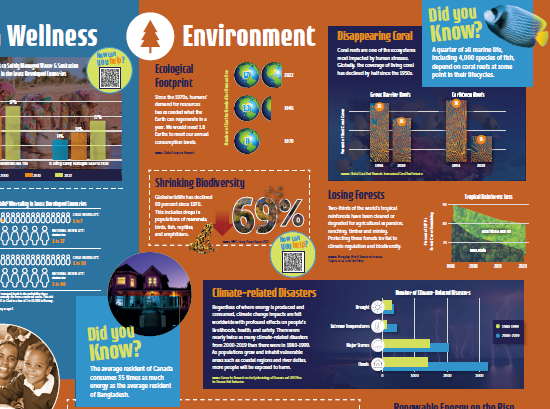
Through collaborative analysis of visual data on the Quick Trip to 8 Billion poster, students investigate how demographics and resource use have changed over time and how we can reduce future environmental impacts.
Students will be able to:
- Read and interpret graphs and charts of demographic, environmental, health, and food statistics.
- Identify actionable ways to reduce human impact on the environment and slow or reverse unsustainable trends.
- Use evidence to answer a compelling question and communicate new knowledge to peers.
Features of This Resource
- E-poster available online – great for virtual learning
- Students identify actionable ways to reduce humans’ negative environmental impacts
- Unique data visualizations provide interesting source of information
How Do I Get This Lesson Plan?
The resource is free. Click the green button for immediate download. Download Now
Other Resources You Might Like:
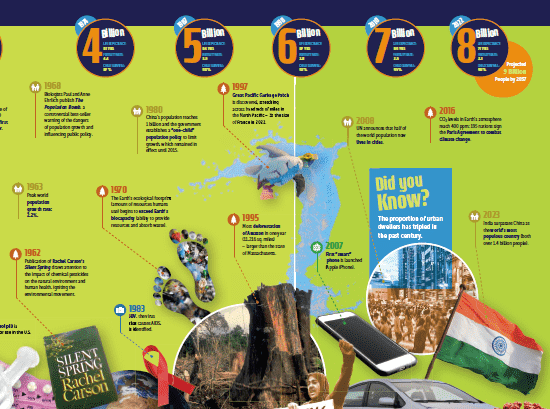
Through written analysis of the timeline on the Quick Trip to 8 Billion poster, students explore how past events have... Read more »
Students interpret various forms of data (graphic, written, and visual) and identify relationships between factors of climate change.

Students calculate the rate of natural increase and corresponding doubling time or half-life for several countries and explore factors that... Read more »
Nice to meet you!
Tell us a bit about yourself so we can continue creating resources that meet your needs.
You’ll only need to fill out this form once. If you’ve already completed the form, you can confirm your email here.