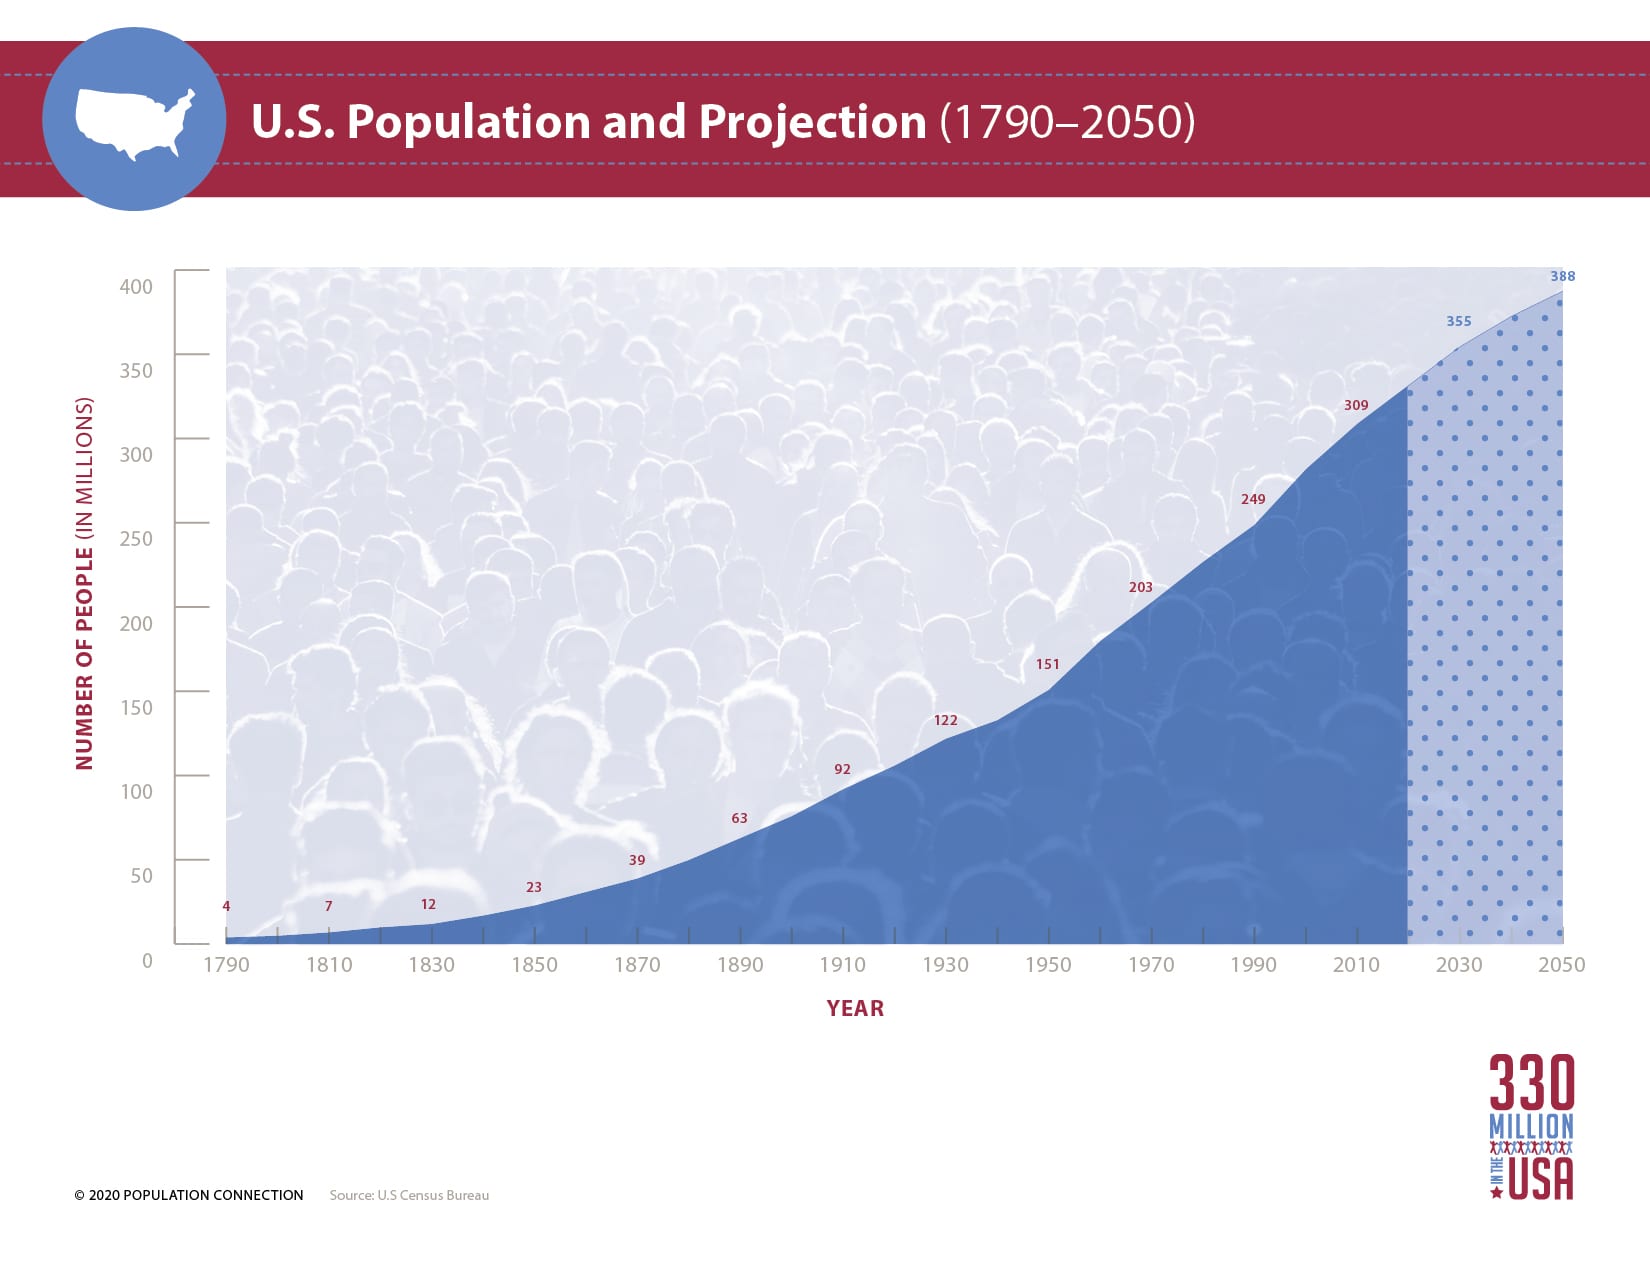
Line graph displays the population of the United States from its founding in 1790, to present, and projected U.S. growth through 2050. The U.S. population reach 100 million around 1920, reached 200 million in the late 1960s, and reached 300 million in 2006. The population of the United States in 2020 is 332 million and it is projected to grow to 388 million by 2050.
Data is from the U.S. Census Bureau.
Graphic produced as part of the 330 Million in the USA lesson packet.

Other Resources You Might Like:

Fun large-group simulation of U.S. population growth since the first census in 1790.
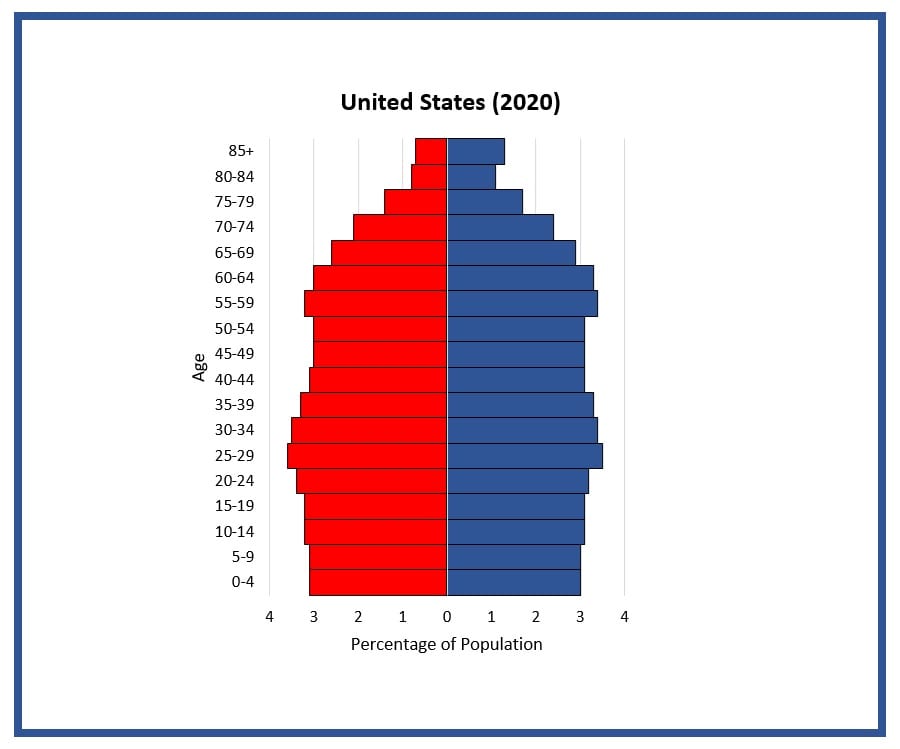
Students construct and interpret population pyramids (age-sex distribution charts) and discuss differences in population characteristics at different points in U.S.... Read more »
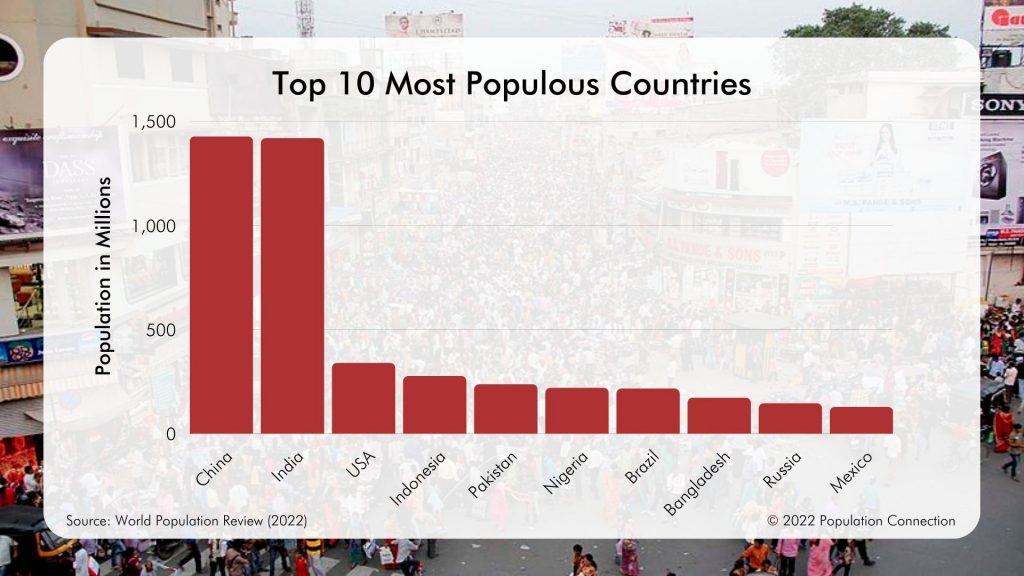
Bar graph shows the populations of the 10 most populous countries. The top 10 most populous countries are: China, India,... Read more »
Nice to meet you!
Tell us a bit about yourself so we can continue creating resources that meet your needs.
You’ll only need to fill out this form once. If you’ve already completed the form, you can confirm your email here.