![]() Earth Day is always a natural opportunity to teach environmental topics in the classroom, and last week we held a webinar for K-8 teachers highlighting some of our best environmental lessons for both in-person and distance learning classrooms. Because our current quarterly theme is “Developing and Using Models,” we narrowed our focus to activities that exemplify different ways to use models for exploring Earth Day concepts. In case you weren’t able to join us for the webinar, read on for a recap of what was covered along with links to all the materials we shared.
Earth Day is always a natural opportunity to teach environmental topics in the classroom, and last week we held a webinar for K-8 teachers highlighting some of our best environmental lessons for both in-person and distance learning classrooms. Because our current quarterly theme is “Developing and Using Models,” we narrowed our focus to activities that exemplify different ways to use models for exploring Earth Day concepts. In case you weren’t able to join us for the webinar, read on for a recap of what was covered along with links to all the materials we shared.
Three Modeling Lessons for Earth Day
This post will summarize the three lessons we shared during the virtual teacher training along with the digital learning tools to adapt these lessons for virtual classrooms. These digital adaptations use Google Slides for interactive worksheets, games, and demonstrations; each template is linked for you to easily copy and share with your own students.
1. Forest Loss Role-Play Activity
The lesson Timber! shows students how human needs for lumber may result in long-term deforestation. Students are divided into groups of four to conduct a simulation of trees growing and being cut down in a forest over time.
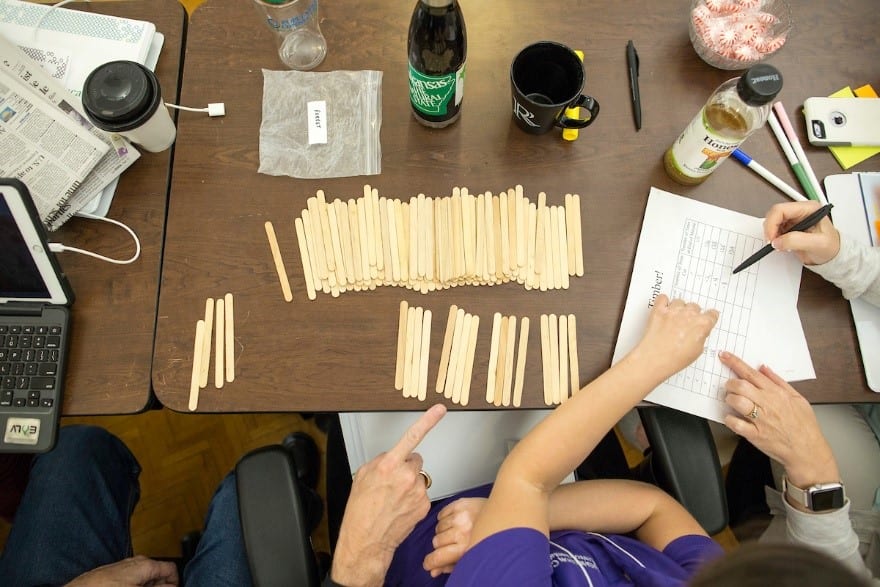
Each group has four roles: the forest, forest manager, lumberjack, and timer. The student playing the forest holds 120 popsicle sticks to represent 120 trees in the forest, and keeps track of forest growth and loss using the chart included in the lesson plan. The forest manager adds popsicle sticks to the forest at designated intervals. The lumberjack periodically cuts down trees at a consistent rate, but cuts an ever-increasing number of trees. The timer watches the clock and signals to their groupmates when to add or remove trees.
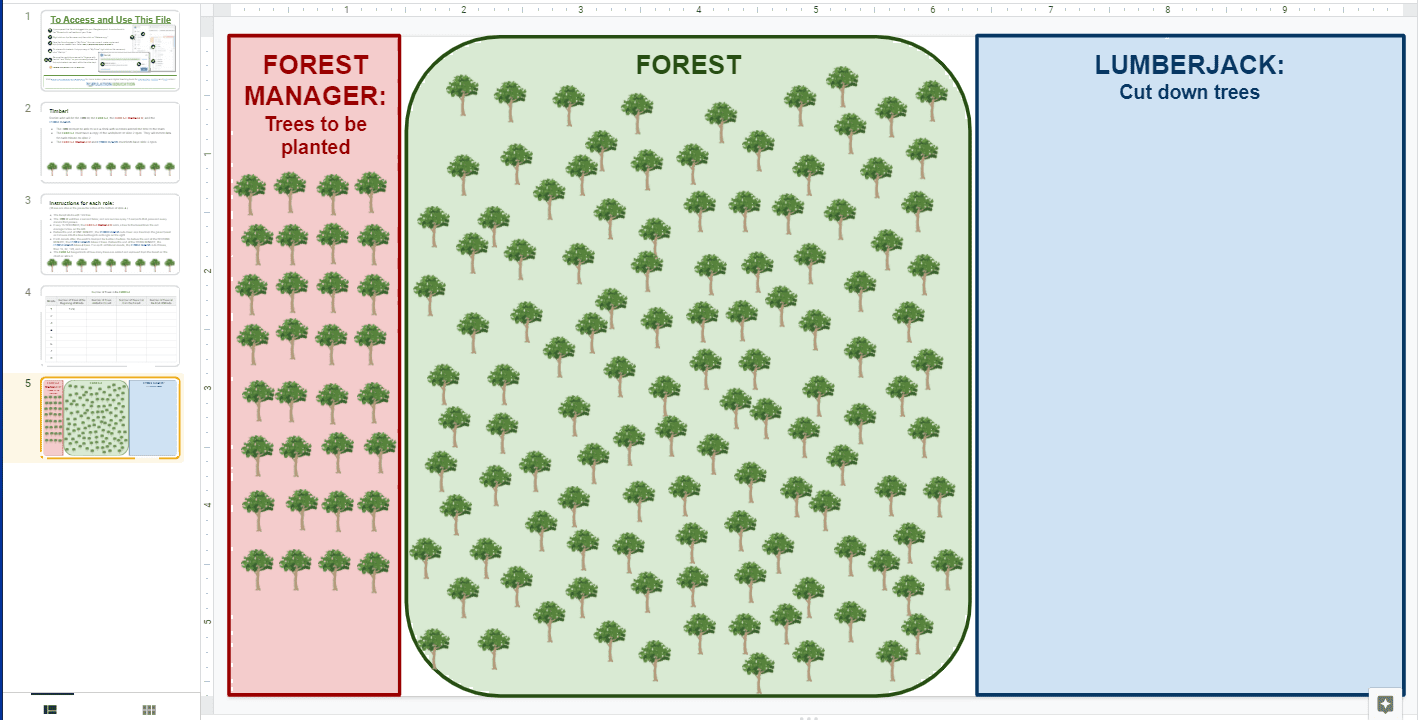
If using the Timber digital tool, students manipulate trees on a Google Slide document instead of using popsicle sticks, but otherwise follow the same process for adding and removing trees from their forest.
At the pace students add/remove trees in the simulation, the whole forest will be cut down in about seven minutes. After debriefing as a class, students take the data they’ve recorded and create a line graph comparing the number of trees cut against the number of trees left at each minute mark.
Challenge students to experiment with ways that the model could be changed to get a different outcome. They may change the supply or demand for trees and run the simulation again to see how the fate of the forest is affected.
2. Modeling Biodiversity for Grades 6-8
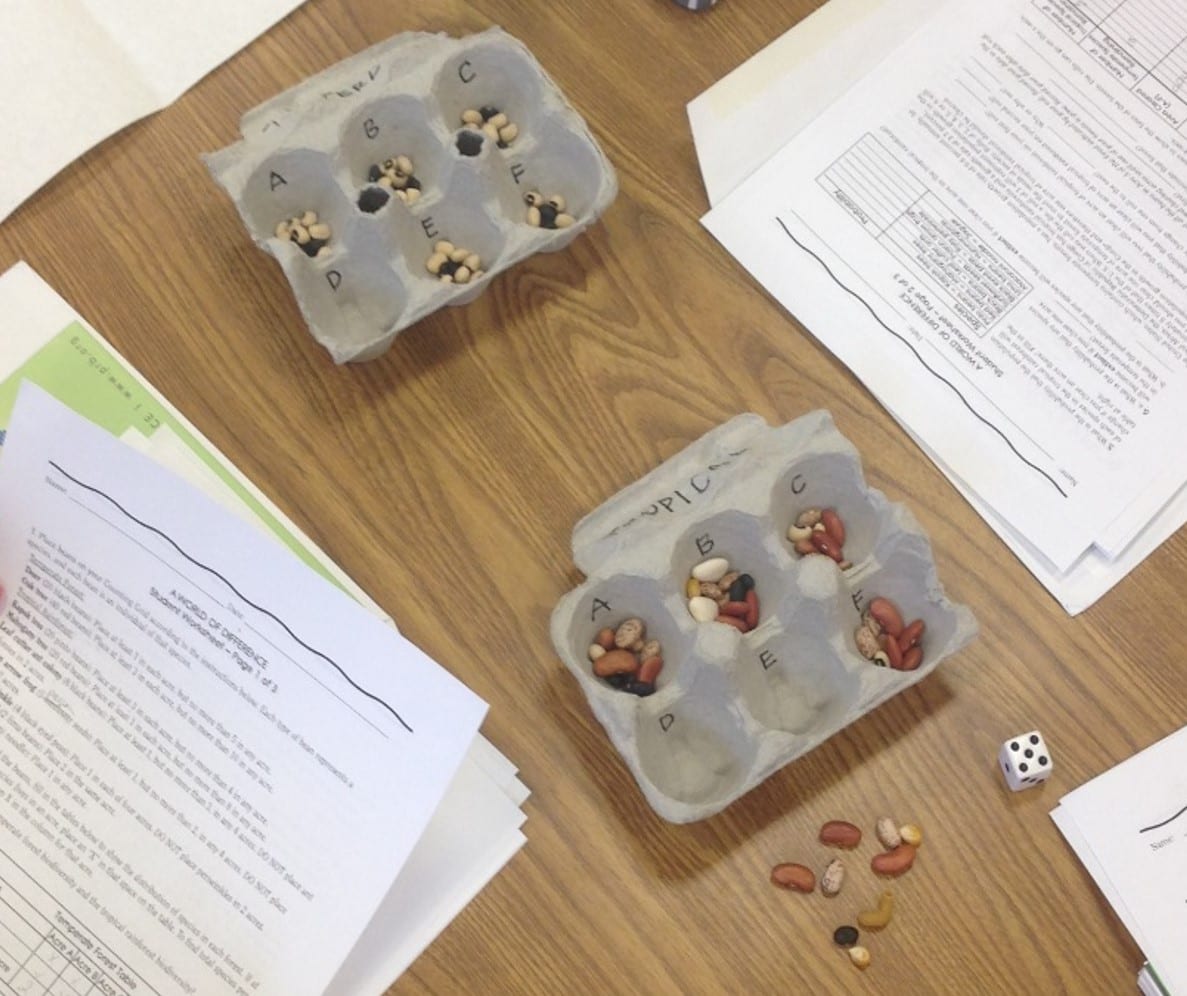
The middle grades lesson World of Difference compares the biodiversity in a temperate forest to that of a tropical forest, then models how deforestation impacts the biodiversity in each forest. Two grids (each six acres, labeled acres A through F) represent the two forests and different kinds of beans represent specific plant and animal species. Students work in small groups to populate their model temperate forest and tropical forests using provided guidelines. The Student Worksheet then guides students through recording the biodiversity present in each forest by marking which species are present in each acre and calculating the probability of change and extinction if an acre of forest were to be cleared.
Once students’ forests are constructed, population growth comes into play. Students discover that their temperate forest represents a forest in the United States and their tropical forest represents a forest in Uganda. After considering why population growth may facilitate forest loss, students introduce that growth to their modeled forests.
Uganda’s population growth rate is about four times that of the United States. Each group rolls a die to determine where that growth will happen: a roll of 1 means population growth in the United States and the clearing of an acre of forest there, while rolls of 2, 3, 4, and 5 means growth in Uganda and the clearing of acre in its forest. Any rolls of 6 are freebies where no forest loss occurred and students move on to the next roll.
As students roll dice and clear corresponding acres of forest, they use the Student Worksheet to keep track of which forest was cleared and how many species are still present in the forests as a whole as the simulation goes on. Though every group’s forest models will be different, on average, the tropical forests are cleared much more quickly than the temperate forests, and students will watch greater biodiversity loss as tropical acres are cleared. Ultimately, students answer questions on the Student Worksheet that consider why biodiversity is important and the ways that biodiversity loss may have far-ranging effects.
The digital tool for World of Difference consolidates everything into one Google Slides file. On these electronic worksheets, forests are represented digitally through different colored symbols, and students use a virtual die to determine which acres are cleared.
3. Classroom Activity on Carrying Capacity and Competition
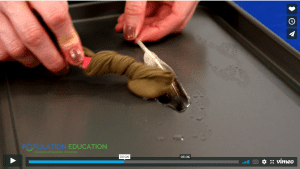
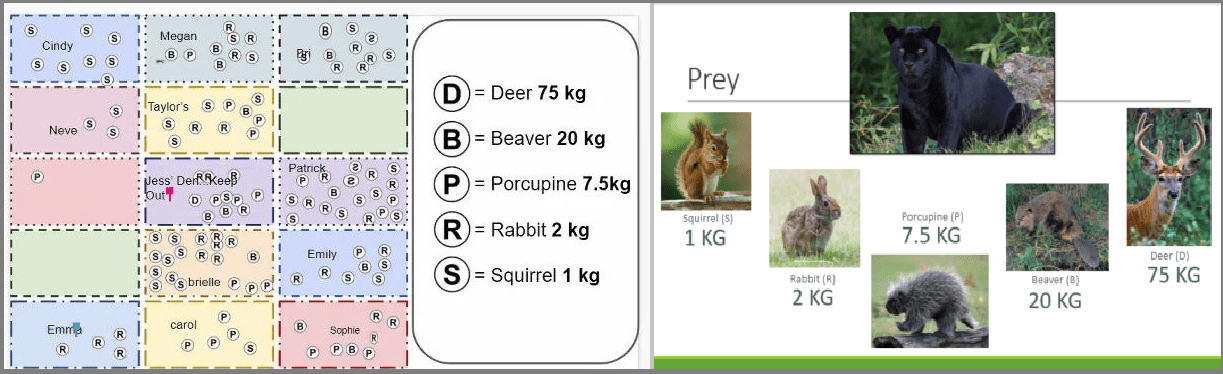
Finally, Panther Hunt transforms students into predators hunting prey for survival. Labeled Dixie cups around the classroom represent different prey animals, providing a unique amount of kilograms of food. Students’ desks become their dens, and they must hunt prey by collecting cups one at a time. There is a limited number of food, and panthers need at least 50kg to survive to the next season.
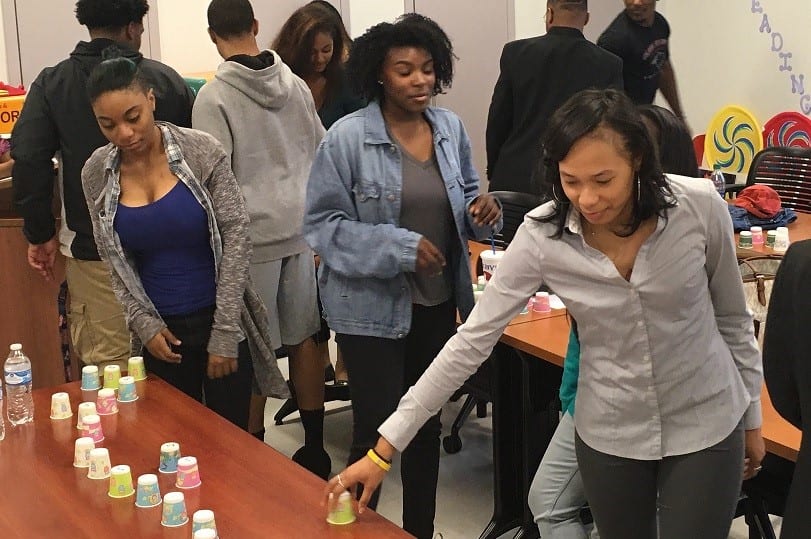
Teachers test out the lesson, Panther Hunt, where students act as panthers and “hunt” for prey to model the concept of habitat carrying capacity.
Once all of the available prey has been hunted, students calculate their totals by adding up all the food represented by their cups and determine whether they have collected enough food to survive. Around half of the students will have collected more than 50kg worth of food. As a whole class, students can work to determine the carrying capacity, or the maximum number of panthers that could have survived given the available food, of this ecosystem.
When doing this activity virtually, students manipulate prey on a Google Slide tool. Instead of getting up and walking to their prey, panthers drag and drop prey animals into their virtual dens. The distribution of prey otherwise remains the same, as does the process for determining carrying capacity.
You can also introduce human impacts into this exploration of animals’ carrying capacity by making variations to the model. Habitat fragmentation can be represented by adding a dividing line between two sections of the classroom to represent a road: panthers may now only hunt in one part of the classroom, affecting their access to prey. Water pollution may be represented by removing all of the beaver cups from the classroom, as aquatic species no longer have livable habitats. Teachers can also assign different roles to students to impact their hunting ability: for instance, a panther might have an injured paw and consequently can’t use their hands to hunt.
More Modeling and Earth Day resources
At Population Education, we’ve been sharing lesson plans, tools, and other resources to help teachers incorporate modeling into their classrooms. Follow us on Facebook, Twitter, or Instagram and search the hashtag #PopEdUsingModels to find everything we’ve shared on this foundational topic.
And download our free Earth Day lesson packs for elementary, middle, and high school classrooms for even more ideas on incorporating Earth Day into your classroom. We can teach these relevant environmental topics even as we practice skills that students will develop now and throughout the rest of their educations.