Resource Overview
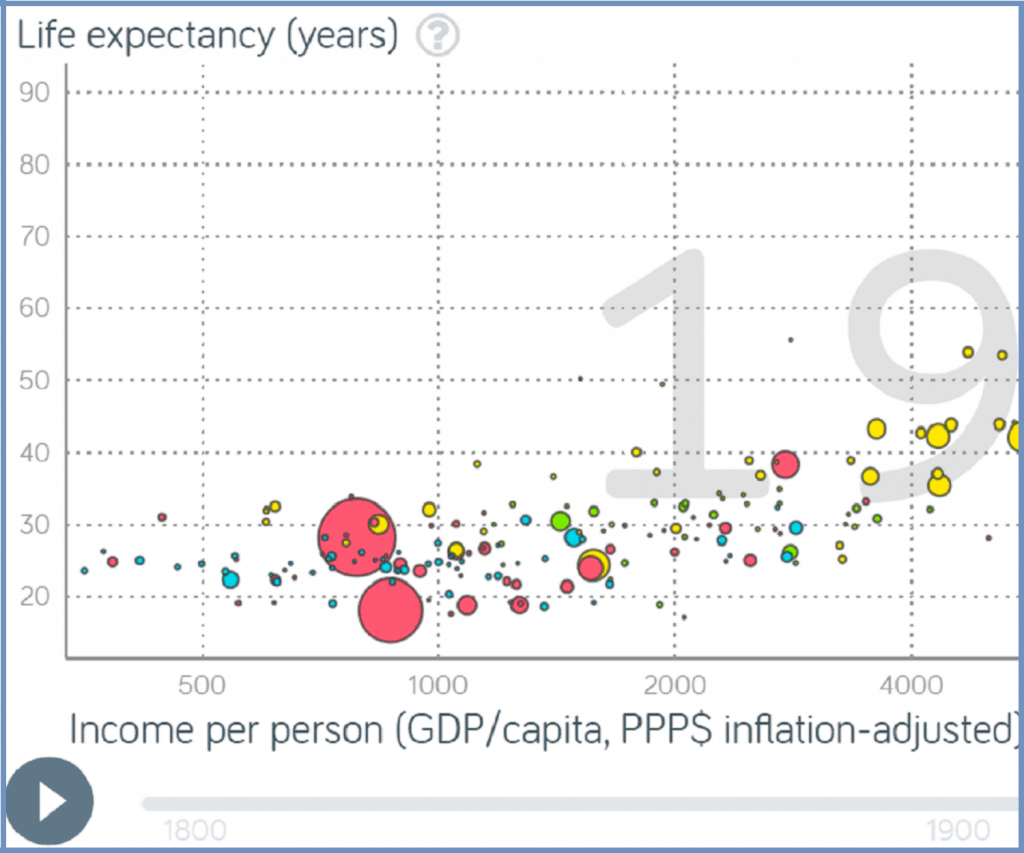
Using the ‘trendalyzer’ program from www.gapminder.org, students construct and interpret dynamic graphs and discuss differences in life expectancy, fertility rates, health, economics, and total population among several different countries.
Features of This Resource
- Technology component through use of dynamic online graphs
- Student-driven inquiry around multiple quality of life indicators
How Do I Get This Lesson Plan?
The resource is free. Click the green button for immediate download. Download Now
Other Resources You Might Like:
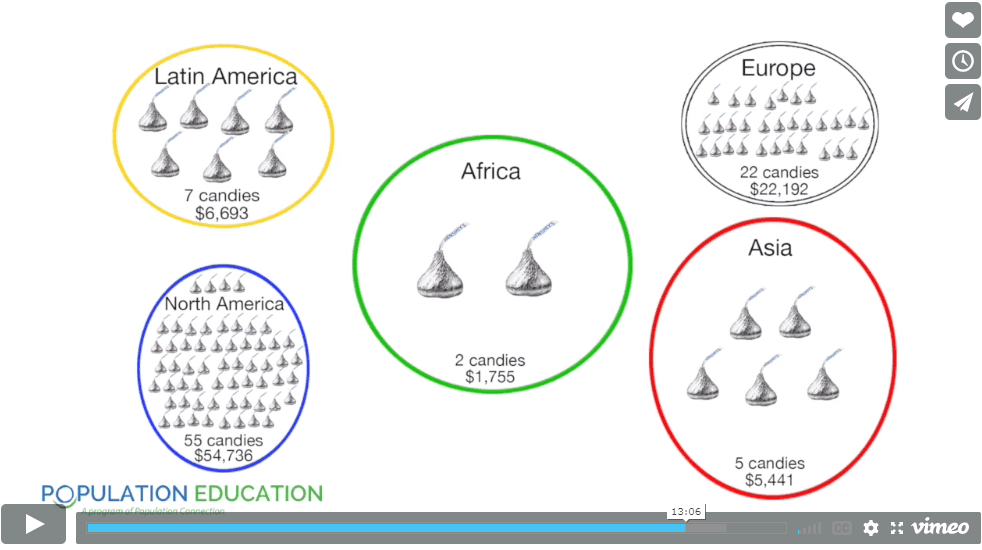
In this engaging global studies activity, students role-play as residents of five major world regions to compare key statistics related... Read more »
Students research and create a visual display summarizing a Sustainable Development Goal then consider the role of social progress in... Read more »
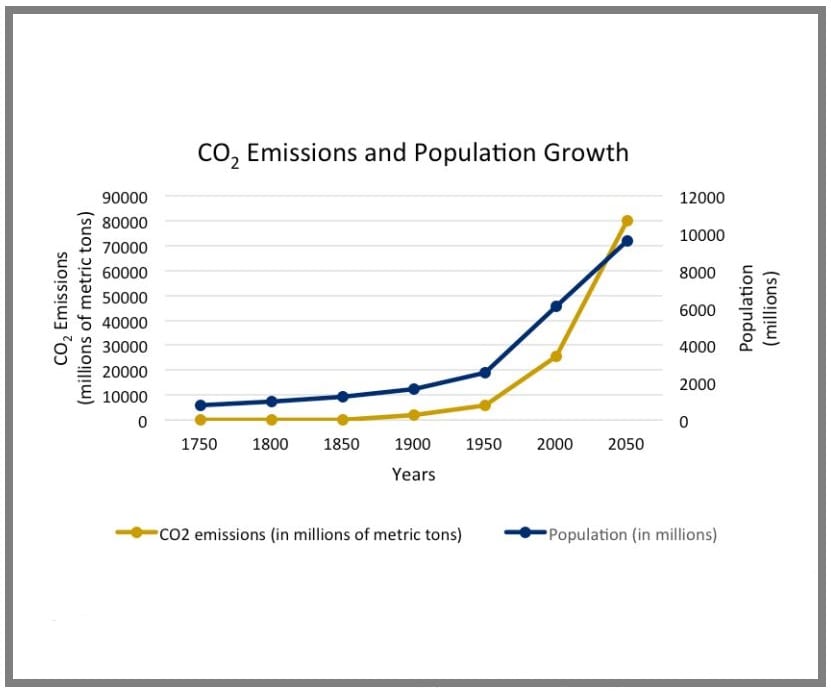
Students graph current carbon dioxide emissions and population growth over time and discuss trends they observe.
Nice to meet you!
Tell us a bit about yourself so we can continue creating resources that meet your needs.
You’ll only need to fill out this form once. If you’ve already completed the form, you can confirm your email here.