Grade Level:
6-8
Teacher Resources

The lesson plans below are all adapted for use with ELL/MLL in inclusive, or ESOL, classrooms. The...
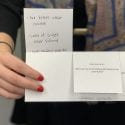
Written and scaffolded for ELL, students develop a community's Sustainability Index and put the Index to use...
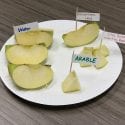
Written and scaffolded for ELL, an apple is sliced into pieces to model the amount of agricultural...

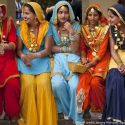
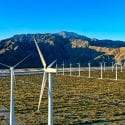
Written for ELL, students interpret photos and historical accounts on human activities that contribute to air pollution,...
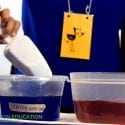
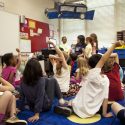
Written and scaffolded for ELL, students observe a short demonstration showing how populations grow when the birth...
PopEd Impact
campuses
"The activities not only bring out important content, but they also provide real-world context for environmental, population and sustainability issues. They engage participants in very thought-provoking and critical-thinking discussions.”
Helen de la Maza, Environmental Educator, Irvine, CA