Grade Level:
6-8
Teacher Resources

Students read a news article about local population growth and the resulting sprawl, create and write a...
Through playing a board game, students are presented with various health-related scenarios that can hurt or help...

Students participate in a budgeting activity to weigh everyday actions against their environmental impact. Students will be...

Students develop an index of factors most important to a sustainable community and develop models for measuring...
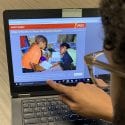
Through planning, writing, and performing a news telecast, students use information from current events articles to create...
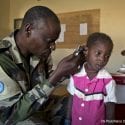
Students read and discuss a short conversation between two Ethiopian girls about attending school and read and...

Students use the engineering design process to create and test prototypes for cleaning up oil spills. Students...
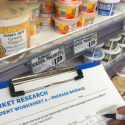
Students visit the supermarket and investigate products’ containers and packaging options to determine which products would produce...

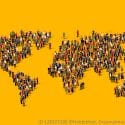
Through riddles and cooperative learning math activities, students work through problems to calculate and visualize millions and...
PopEd Impact
campuses
"The activities not only bring out important content, but they also provide real-world context for environmental, population and sustainability issues. They engage participants in very thought-provoking and critical-thinking discussions.”
Helen de la Maza, Environmental Educator, Irvine, CA