Grade Level:
6-8
Teacher Resources

Six cards that compare resource use in the United States and worldwide.

Students write about predictions of a U.S. environmental, social, or demographic topic in 2070.
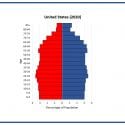
Students construct and interpret population pyramids (age-sex distribution charts) and discuss differences in population characteristics at different...

Students multiply ratios, divide units of time, and subtract death rates from birth rates to calculate population...

Riddles that help students conceptualize large numbers and understand the concepts of exponential growth and doubling time.
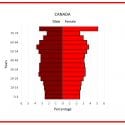
Students use real-world data to construct and interpret population pyramids and discuss differences in population growth rates...
Fun large-group simulation of U.S. population growth since the first census in 1790.
Students identify ways that many factors in human society and the natural environment are interdependent by creating...
Nine question quiz designed to give teachers and students an overview of world and U.S. population trends....
PopEd Impact
campuses
"The activities not only bring out important content, but they also provide real-world context for environmental, population and sustainability issues. They engage participants in very thought-provoking and critical-thinking discussions.”
Helen de la Maza, Environmental Educator, Irvine, CA