Grade Level:
6-8
Teacher Resources
Acting as residents of five major world regions, students compare various statistics that affect people’s health and...
Students graph data on international demographics, environmental trends and indicators of human well-being using box plots, stem-and-leaf...
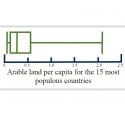
Through research and analysis of their consumption of renewable resources, students measure the amount of land that...
A secondary reading that provides an overview of world population trends and lifestyles around the world.

Students multiply ratios, divide units of time, and subtract death rates from birth rates to calculate population...

Through an interactive story, grade 3-5 students experience the pollution of a local river over time and...
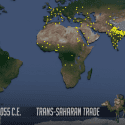
This powerful population growth video provides a fast-paced visual overview of human population trends from 1 CE...
Through a short-story and discussion about teen pregnancy, and by interpreting a graph about global literacy and...

Students create a population density map of U.S. population over time, from 1800 to today.
PopEd Impact
campuses
"The activities not only bring out important content, but they also provide real-world context for environmental, population and sustainability issues. They engage participants in very thought-provoking and critical-thinking discussions.”
Helen de la Maza, Environmental Educator, Irvine, CA