Grade Level:
6-8
Teacher Resources
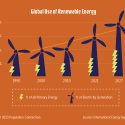
The percentage of global energy use from renewable sources has increased since 1990.


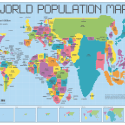
Overview of population cartogram: what is it, when it's used, and limitations.

In this interdisciplinary environmental science lesson, students graph real-world data on global meat production, use hands-on manipulatives...


In this interdisciplinary activity, students take on the role of store owners and conduct a mini-census to...
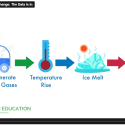
In this climate change and data analysis lesson, students engage with a variety of data formats—including graphs,...
PopEd Impact
campuses
"The activities not only bring out important content, but they also provide real-world context for environmental, population and sustainability issues. They engage participants in very thought-provoking and critical-thinking discussions.”
Helen de la Maza, Environmental Educator, Irvine, CA