Grade Level:
9-12
Teacher Resources
The role and status of women around the world is very closely tied to fertility rates and...
Just a hundred years ago the world’s population had yet to reach two billion, less than a...
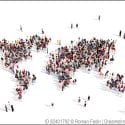
Students watch the video “World Population” and participate in guided exploration of an online timeline to explore...
Students access www.WorldPopulationHistory.org to research historical events and determine which events they deem to be most important in meeting...

Students write, film and edit a short video that connects human population growth to one other global...

As the instructor reads a historic story, students add and extract items from a model ocean based...
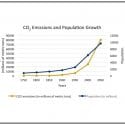
Students graph current carbon dioxide emissions and population growth over time and discuss trends they observe.

In a simulation, students desiring to draw renewable resources from a common pool determine short-term consumption strategies...
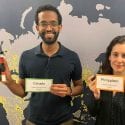
Explores how the amount of carbon emitted and vulnerability to climate-related risks varies between countries.
PopEd Impact
campuses
"The activities not only bring out important content, but they also provide real-world context for environmental, population and sustainability issues. They engage participants in very thought-provoking and critical-thinking discussions.”
Helen de la Maza, Environmental Educator, Irvine, CA