Grade Level:
9-12
Teacher Resources
As the instructor reads a historic story, students add and extract items from a model ocean based...
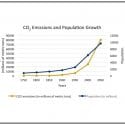
Students graph current carbon dioxide emissions and population growth over time and discuss trends they observe.
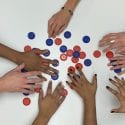
In a simulation, students desiring to draw renewable resources from a common pool determine short-term consumption strategies...
Explores how the amount of carbon emitted and vulnerability to climate-related risks varies between countries.
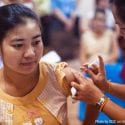
Representing different countries, students step forward or backward based on health conditions in their borders, to find...
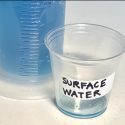
Students observe a brief demonstration on the distribution of the world’s water and then calculate how much...
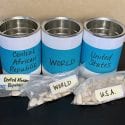
Students compare wealth of the average person in the world to that of a person living in...
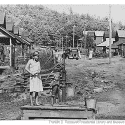
Acting as presidents from various points in history, students compare U.S. demographic and environmental statistics.
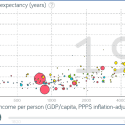
Using the ‘trendalyzer’ program from www.gapminder.org, students construct and interpret dynamic graphs and discuss differences in life...
PopEd Impact
campuses
"The activities not only bring out important content, but they also provide real-world context for environmental, population and sustainability issues. They engage participants in very thought-provoking and critical-thinking discussions.”
Helen de la Maza, Environmental Educator, Irvine, CA