Forest loss in Indonesia and the Brazilian Amazon as a percentage of 1970s forest remaining in 2020.

Earth graphics display human's growing global footprint from 1970 to 1995 to 2022.

Comparison graphs of two coral reefs' shrinking size over recent 25 year period.

Infographics shows that 1 person in the U.S. consumes as much energy as 2 French, 11 Indians,...

Average number of people per house and average house size in the U.S., 1790-2019.

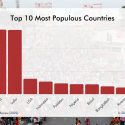
Bar graph shows the populations of the 10 most populous countries. The top 10 most populous countries...

In this role-playing simulation, students discover what happens to a forest when the demand for wood is...

Students construct a word web to show the possible cause and effect relationships of a growing population....

Students experience the changing pace of population growth by simulating the Earth’s population growth over the last...
PopEd Impact
campuses
"The activities not only bring out important content, but they also provide real-world context for environmental, population and sustainability issues. They engage participants in very thought-provoking and critical-thinking discussions.”
Helen de la Maza, Environmental Educator, Irvine, CA

