Grade Level:
6-8
Teacher Resources

Students consider how today’s personal choices can positively impact the future of local and global communities and...
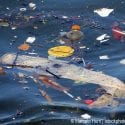
Water resources background reading: Earth’s water system is under stress from pollution and overuse. Students explore the...
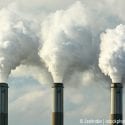
Air pollution and solid waste background reading: Trash, pollution, and emissions increase as human population grows and...
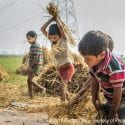
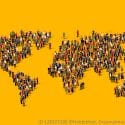
Our global family background reading: There are vast differences in wealth, energy use, health, and education levels...
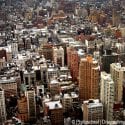
Population concepts background reading: Understanding demographics is foundational to population studies. Students examine key population concepts including...
Students use mathematical formulas to calculate growth rates and doubling times, and to determine the difference between...
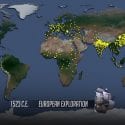
Students watch the video, World Population, and analyze trends in human population over the last 2,000 years....

Students interpret photos and analyze historical accounts to deduce what human activities contribute to air pollution, and...
Acting as residents of five major world regions, students compare various statistics that affect people’s health and...
PopEd Impact
campuses
"The activities not only bring out important content, but they also provide real-world context for environmental, population and sustainability issues. They engage participants in very thought-provoking and critical-thinking discussions.”
Helen de la Maza, Environmental Educator, Irvine, CA