Grade Level:
9-12
Teacher Resources
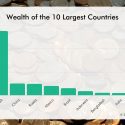
Bar graph shows the per capita GDP for the world’s ten most populous countries. Of the world’s...
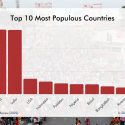
Bar graph shows the populations of the 10 most populous countries. The top 10 most populous countries...
A pre-test/post-test quiz designed to give students an overview of world population trends and the consequences of...
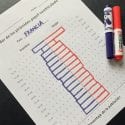
Students construct and interpret population pyramids and discuss differences in population growth rates among several different countries.
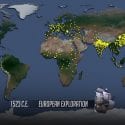
Students watch the video, World Population, and analyze trends in population change over the last 2,000 years.

Acting as residents of five major regions of the world, students compare various statistics that affect people’s...
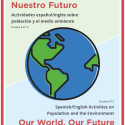
Spanish/English lessons for 6 - 12th grade teachers cover sustainability and population change
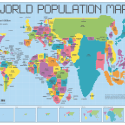
This lesson plans linked below accompany the World Population Map, a population cartogram. Population Squared is an...
PopEd Impact
campuses
"The activities not only bring out important content, but they also provide real-world context for environmental, population and sustainability issues. They engage participants in very thought-provoking and critical-thinking discussions.”
Helen de la Maza, Environmental Educator, Irvine, CA