Filter
Resources
Classroom Resources
Lesson Plan:

Students articulate their thoughts about the ethical issues related to population reaching seven billion and...
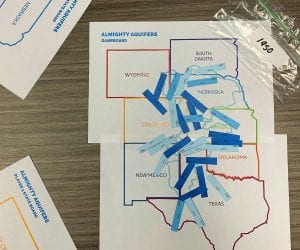
Students participate in a game that mimics the relationship between population growth and aquifer depletion....

Students use mathematical formulas to calculate growth rates and doubling times, and to determine the...
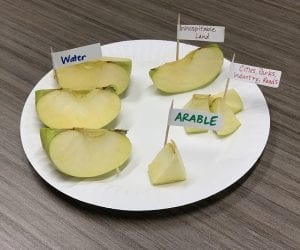
An apple is sliced into pieces to model the current amount of agricultural land on...
Students examine their own values by considering various environmental dilemmas and evaluating how different reactions...
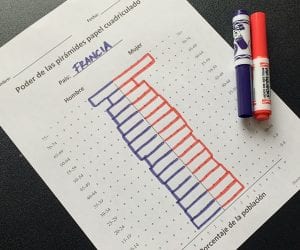
Students construct and interpret population pyramids and discuss differences in population growth rates among several...

Acting as store owners, students conduct a mini-census to identify their potential market and then...
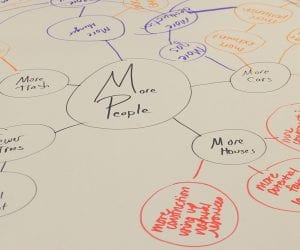
Students create a concept map in cooperative learning groups to display cause and effect relationships...
A pre-test/post-test quiz designed to give students an overview of world population trends and the...
Reading:
Secondary-level reading explores the relationship between U.S. people and the natural environment from early settlements...
A secondary reading that provides an overview of world population trends and lifestyles around the...

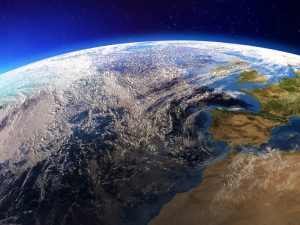
Sustainable future background reading: Sustainable thinking is key to ensuring a healthy planet in the...
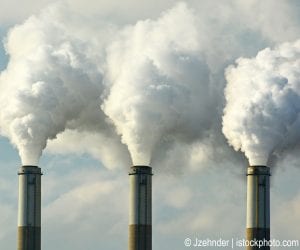
Air pollution and solid waste background reading: Trash, pollution, and emissions increase as human population...
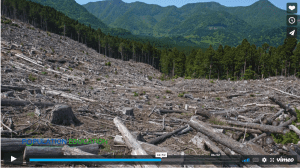
Land use background reading: As population grows, we develop wild areas and arable land and...

Water resources background reading: Earth’s water system is under stress from pollution and overuse. Students...
Lesson Packet:
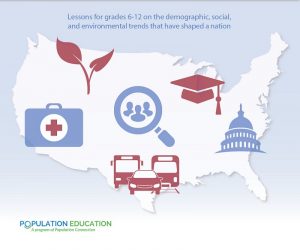
U.S. population takes center stage in this downloadable packet of classroom lessons, 330 Million in...
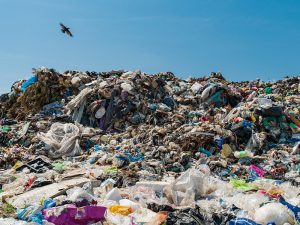
Thematic unit for the middle school classroom covers issues related to garbage and solid waste...

Packet of 2024 Earth Day lesson plans for 6th, 7th and 8th grades is free...
Thematic unit for the middle school classroom covers population growth from 1 CE to present...
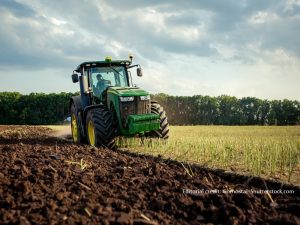
Thematic unit for the middle school classroom covers how humans have manipulated land for our...

This is a Spanish/English lesson packet for 6th - 12th grade teachers. It is designed...

Thematic unit for the middle school classroom on challenges impacting the well-being and happiness of...

Thematic unit for the middle school classroom on basic population dynamics. Understanding demographics is foundational...
Population Lesson Plans for NCERT Science and Geography is a set of lesson plans for...
Video:

A visual demonstration of the limited farmland available on Earth (instructor cuts an apple to...

Acting as store owners, students conduct a mini-census to identify their potential market and then...
In two simulation games, students determine individual short-term consumption strategies that will maximize resources for...

Students develop an index of the ten factors they identify as most important to a...

Students use the engineering design process to create and test prototypes for cleaning up oil...
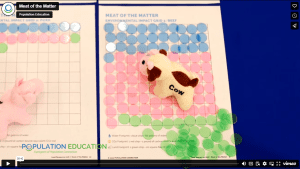
Students graph global meat production, use manipulatives to explore the environmental impact of four different...

After matching everyday products to their rock or mineral sources, students “mine” chocolate chip cookies...
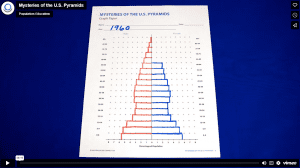
Students construct and interpret population pyramids (age-sex distribution charts) and discuss differences in population characteristics...

Students gain an understanding of carrying capacity when they act as predatory animals in a...
Tool:
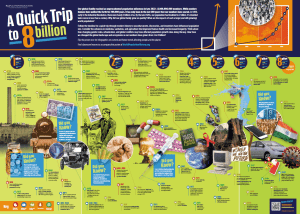
Colorful, informative poster makes the perfect classroom wall decoration - it inspires conversations and questions....
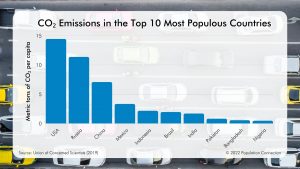
Bar graph shows the amount of carbon dioxide per capita, in metric tons, is emitted...

Six cards that compare resource use in the United States and worldwide.
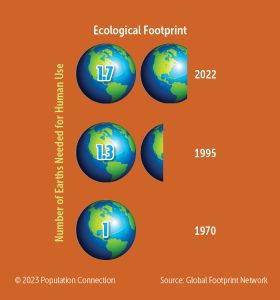
Infographic compares the number of Earths needed to provide for humans' current consumption over time....
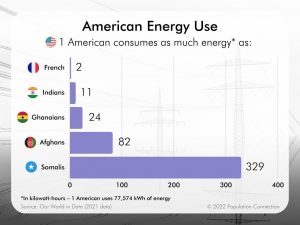
Infographics shows that 1 person in the U.S. consumes as much energy as 2 French,...
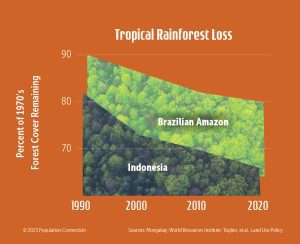
Line graphs of tropical rainforest loss. Graphs display forest loss in Indonesia and the Brazilian...
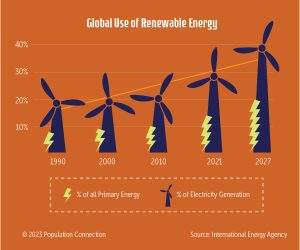
Bar graph compares the percentage of global energy use that is from renewable sources in...
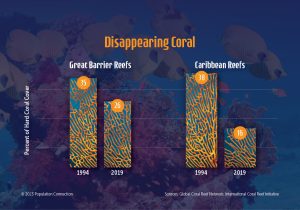
Graphs show the percentage of the Caribbean Reefs and Great Barrier Reefs over 25 years,...
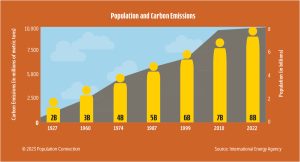
Bar graph shows change in global population from 2 billion people in 1927 to 8...