Filter
Resources
Classroom Resources
Lesson Plan:
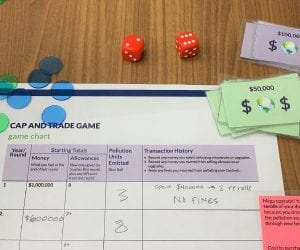
Students play a game that simulates a cap and trade system, and analyze its successes...
Students use a timeline to explore energy-related environmental issues through history then compare countries based...
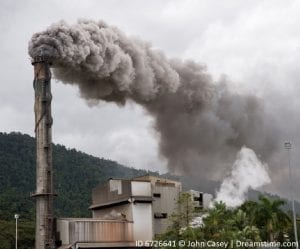
Students find articles about air pollution issues and use the information to create a class...
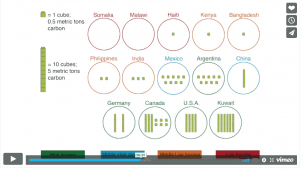
Students solve word problems and use packing peanuts to visualize how much CO2 is produced...

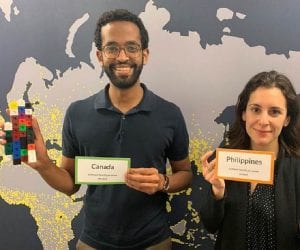
Students research an energy-related topic in the United States or Canada and consider possible alternatives,...
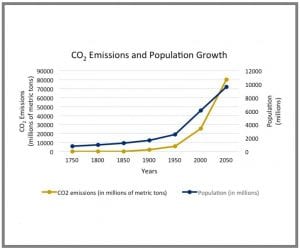
Students graph carbon dioxide emissions and population growth over time and discuss trends they observe....
Students create and conduct a survey to identify a local transportation issue and develop a...

Students graph global meat consumption, use manipulatives to explore the environmental impact of four different...
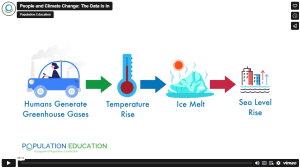
Through graphing and guided questioning students examine the cause and effect relationship between human activities...
Reading:
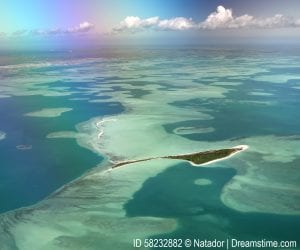
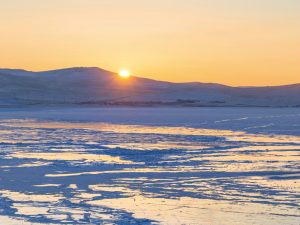
Climate change case study reading: A profile of Kiribati, a nation of islands in the...
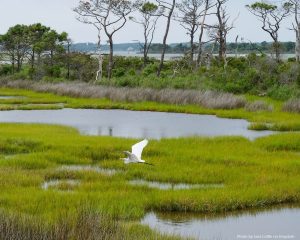
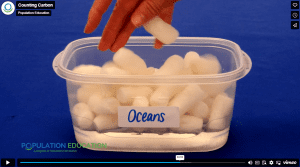
Oceans background reading: Take a closer look at the largest habitat on Earth and see...
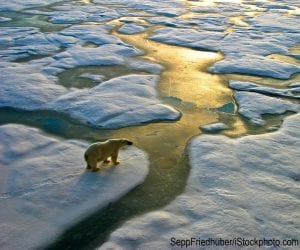
Climate change background reading: An overview of how human activities have increased greenhouse gas emissions,...

Air pollution case study reading: Examine the impact of sulfuric smog in London from the...
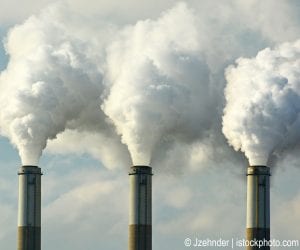
Air pollution and solid waste background reading: Trash, pollution, and emissions increase as human population...

Health background reading: Explore how stresses to our global environment affect public health and nature's...
Lesson Packet:
Thematic unit for the high school classroom covers a wide range topics related to climate...

Packet of 2025 Earth Day lesson plans for K - 5th grades is free to...

Packet of 2025 Earth Day lesson plans for 9th - 12th grades. Free to download!...
Packet of 2025 Earth Day lesson plans for 6th, 7th and 8th grades is free...
Video:
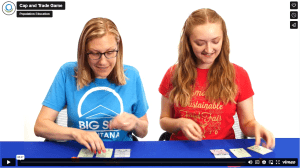
Explore how cap-and-trade systems work with this engaging classroom simulation video. Designed for middle and...
In this engaging climate change lesson, students collaborate in small groups to explore key environmental...
In this climate change lesson, students solve real-world word problems and use packing peanuts to...
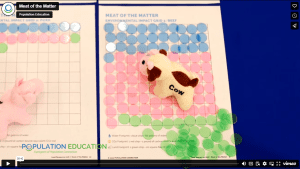
In this interdisciplinary environmental science lesson, students graph real-world data on global meat production, use...
In this climate change and data analysis lesson, students engage with a variety of data...
Tool:
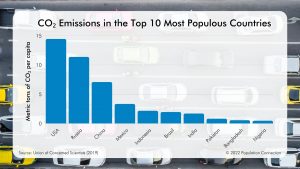
Bar graph shows the amount of carbon dioxide per capita, in metric tons, is emitted...

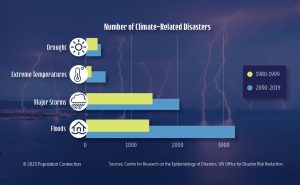
Infographic compares the number of climate-related disasters between 1980-1999 with the number of disasters between...
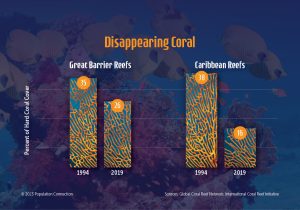
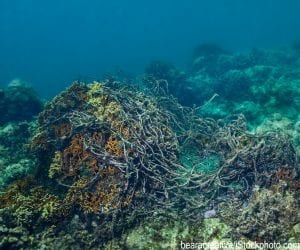
Graphs show the percentage of the Caribbean Reefs and Great Barrier Reefs over 25 years,...
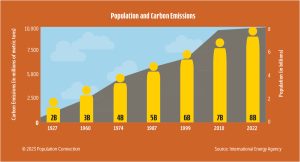
Bar graph shows change in global population from 2 billion people in 1927 to 8...
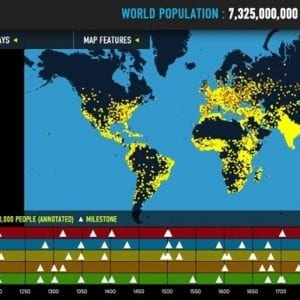
The cornerstone of World Population History is an interactive map of the world, where dots...