Filter
Resources
Classroom Resources
Lesson Plan:
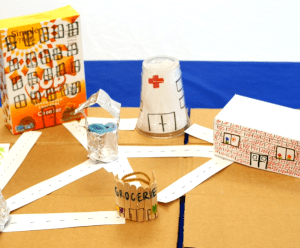
Small groups construct 3-D communities using various amounts of funds and then compare the communities...
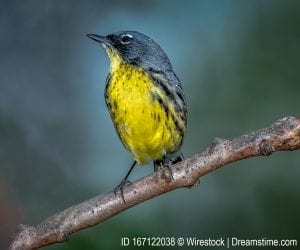
Students determine a list of criteria to use when deciding the fate of endangered species,...
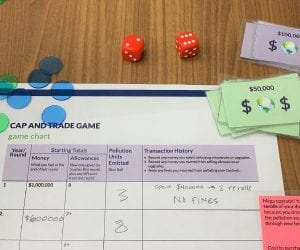
Students play a game that simulates a cap and trade system, and analyze its successes...

Students use a timeline to explore energy-related environmental issues through history then compare countries based...

Students mimic the spread of disease by exchanging liquids in test tubes in a hands-on...

Acting as countries in a simulation game, students discuss how resources are inequitably distributed throughout...

Students experience the changing pace of population growth by simulating the Earth’s population growth over...
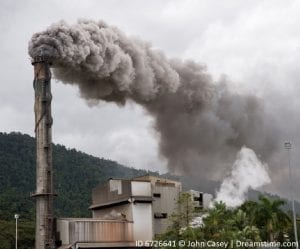
Students find articles about air pollution issues and use the information to create a class...

As the instructor reads a story about the history of the world’s ocean, students act...
Reading:
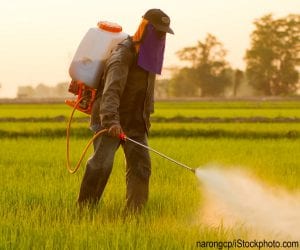
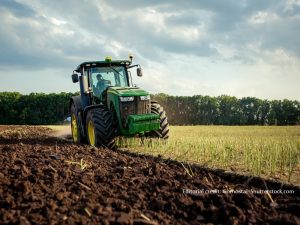
Food and Agriculture case study reading: How are pollinators critical to our food supply, and...

Personal consumption case study reading: Examine how fast fashion (like H&M, Zara, Shein, etc.) impacts...
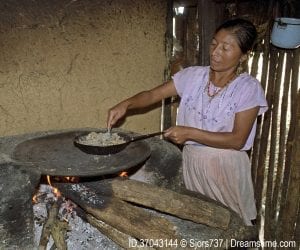
Air pollution case study reading: Learn about initiatives to tackle health problems of indoor air...
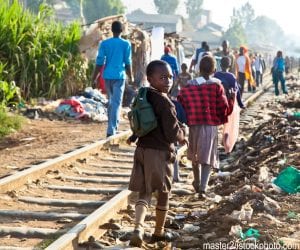
Poverty background reading: More than one billion people around the world live in poverty and...
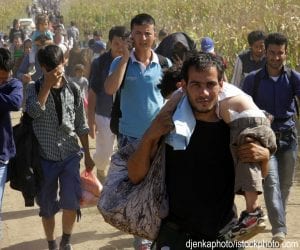
Population Dynamics case study reading: Explore migration to the European Union: the push factors forcing...
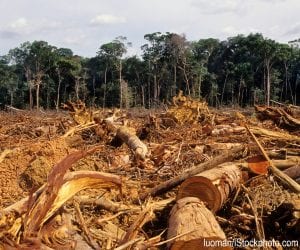
Forests background reading: The world's forests are important ecosystems in regulating climate and nurturing wildlife....
Population concepts background reading: Understanding demographics is foundational to population studies. Students examine key population...

Climate change case study reading: A profile of Kiribati, a nation of islands in the...

Solid waste case study reading: A profile of the world’s former largest e-waste dumping ground,...
Lesson Packet:
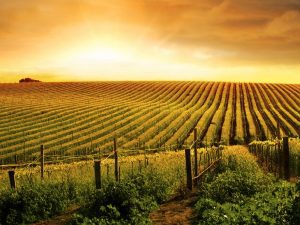
Thematic unit for the high school classroom on food issues and agriculture. Includes teaching materials...
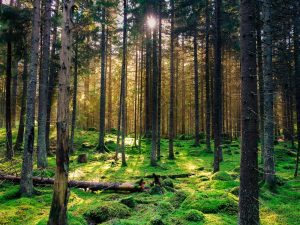
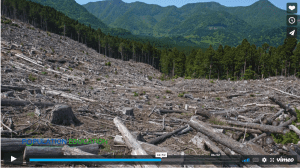
Thematic unit for the high school classroom forest land use and protection, in light of...

Thematic unit for the high school classroom covers global health from a societal perspective. Includes...
Thematic unit for the middle school classroom covers population growth from 1 CE to present...
Thematic unit for the middle school classroom covers how humans have manipulated land for our...
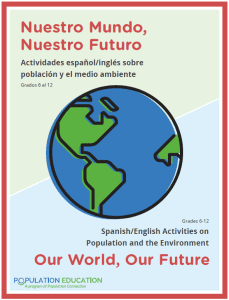
This is a Spanish/English lesson packet for K - 5th grade teachers. It is designed...
This is a Spanish/English lesson packet for 6th - 12th grade teachers. It is designed...

Thematic unit for the high school classroom on ocean health. Includes teaching materials on current...

Thematic unit for the middle school classroom on challenges impacting the well-being and happiness of...
Video:

In this interdisciplinary activity, students take on the role of store owners and conduct a...
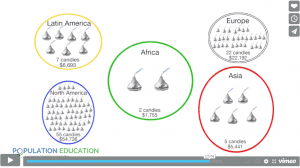
In this engaging global studies activity, students role-play as residents of five major world regions...
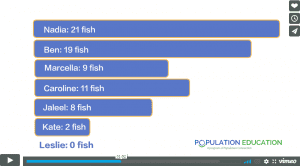
In two interactive simulation games, students develop and apply short-term consumption strategies to maximize shared...

In this engaging two-part elementary lesson, students first explore the impact of outdoor environments on...
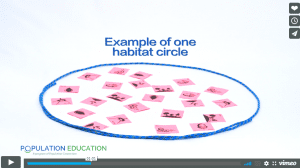
In this fun interactive activity, students role-play as plants or animals collecting vital habitat elements...
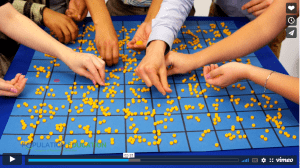
Students estimate population size by using math manipulatives on a grid in this hands-on sampling...

Students identify the ten most important factors for a sustainable community and create measurable indicators...

In this environmental education lesson, young students learn about sustainability and collective responsibility by creating...
Tool:
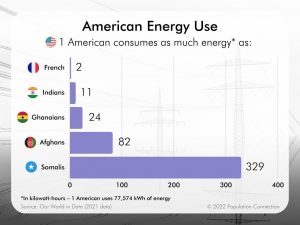
Infographics shows that 1 person in the U.S. consumes as much energy as 2 French,...
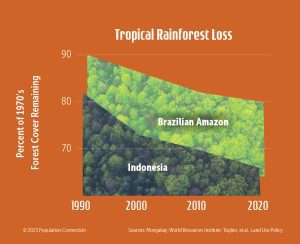
Line graphs of tropical rainforest loss. Graphs display forest loss in Indonesia and the Brazilian...
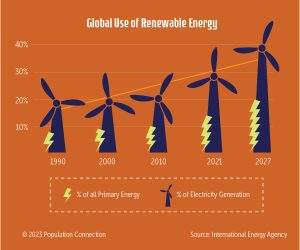
Bar graph compares the percentage of global energy use that is from renewable sources in...
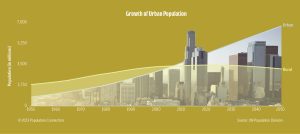
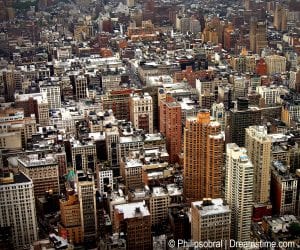
Line graphs show the number of people living in rural areas and urban areas from...
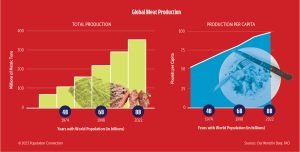
Infographics show the change in global meat production from 1974 to 2022 and the corresponding...
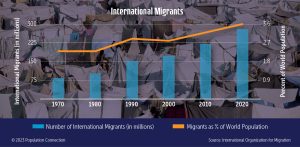
Bar chart shows the number of international migrants from 1970 to 2020, in 10-year increments....
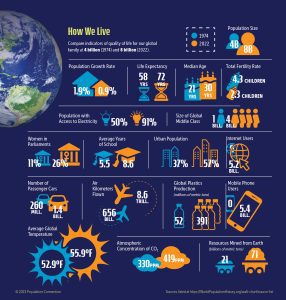
18 graphics compare a wide variety of global indicators between 1974 (when global population was...
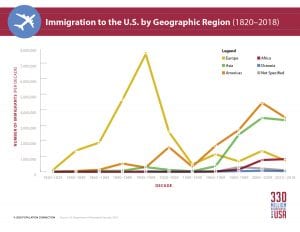
Line graph displays the number of immigrants to the U.S. by home region over time....
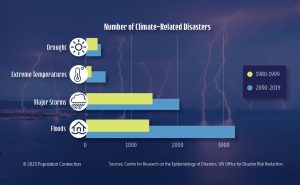
Infographic compares the number of climate-related disasters between 1980-1999 with the number of disasters between...